
Weekly Market Outlook: S&P 500 Back To The Inflection Point
Another week, another win. The S&P 500 inched 0.7% higher from the prior Friday's close last week, marking the third weekly gain in the past four weeks, and the sixth in the past eight. Yet, the index is only up 2.6% for the past six weeks. The tepid advance ultimately reflects the fact that the S&P 500 -- and the broad market -- continues to grapple with a major ceiling. Indeed, the more it grapples, the better-defined and stronger that resistance becomes.
And now, another potential stumbling block is back in play. Or, maybe it's a bullish catapult. We'll dissect it below, as always. First though, let's run through last week's major economic news and preview what's coming this week. There are a few biggies in the lineup.
Economic Data Analysis
The stream of economic reports last week was pretty steady, but there was only one set of real interest: inflation, for consumers as well as factories and production plants. It's still uncomfortably high, even though some measures cooled off just a bit.
Producers' input prices came in above expectations, and are 7.8% above last year's costs -- when we were in the thick of the pandemic's shutdowns. Consumers' costs now stand 5.4% higher year-over-year, or 4.3% not counting ever-volatile food and energy costs.
Inflation Rate Charts
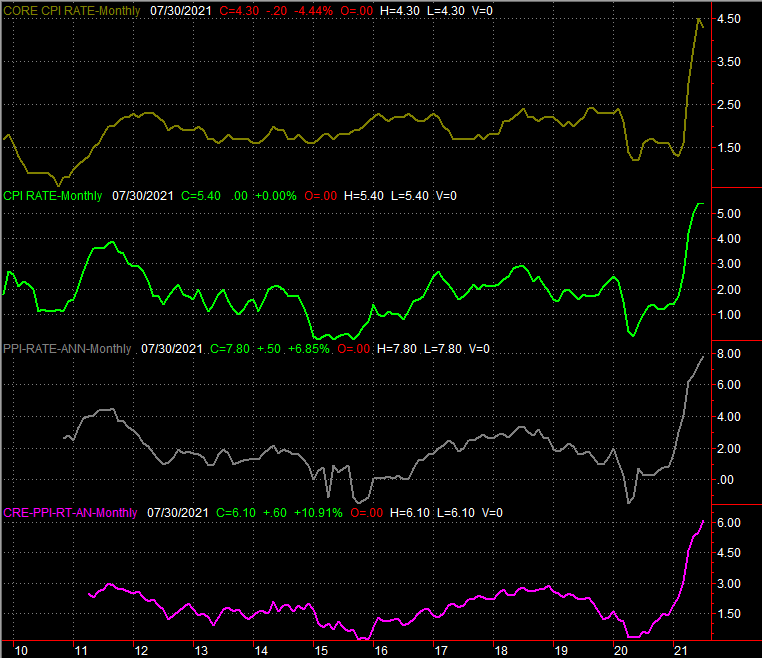
Source: Bureau of Labor Statistics, TradeStation
Everything else is on the grid.
Economic Calendar
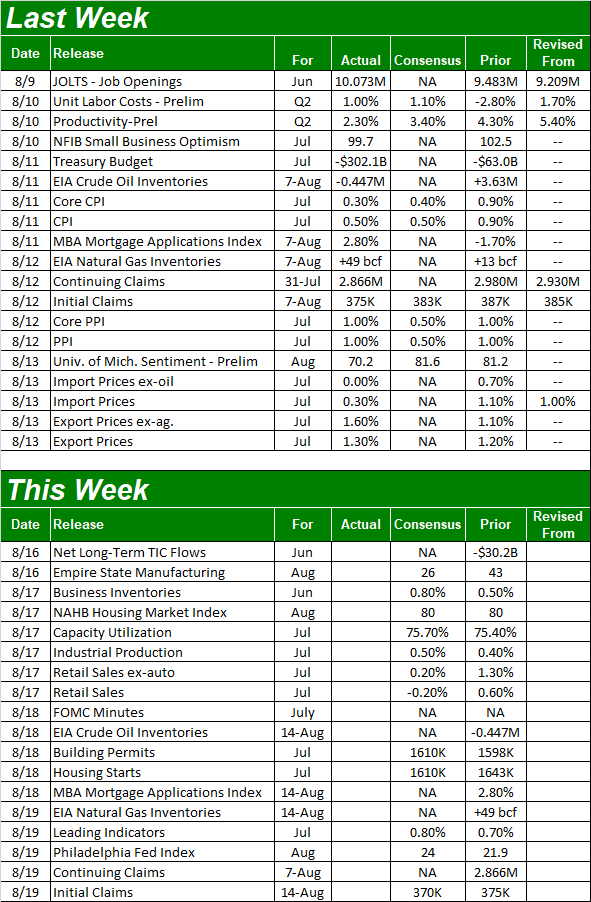
Source: Briefing.com
This week's party starts in earnest on Tuesday with last month's capacity utilization and industrial production numbers from the Fed, and July's retail sales data from the Census Bureau.
Although the recovery from the COVID-19 slowdown is tapering off, economists are looking for a little more forward progress in terms of industrial output as well as use of the country's capacity to make things.
Capacity Utilization and Industrial Productivity Rate Charts
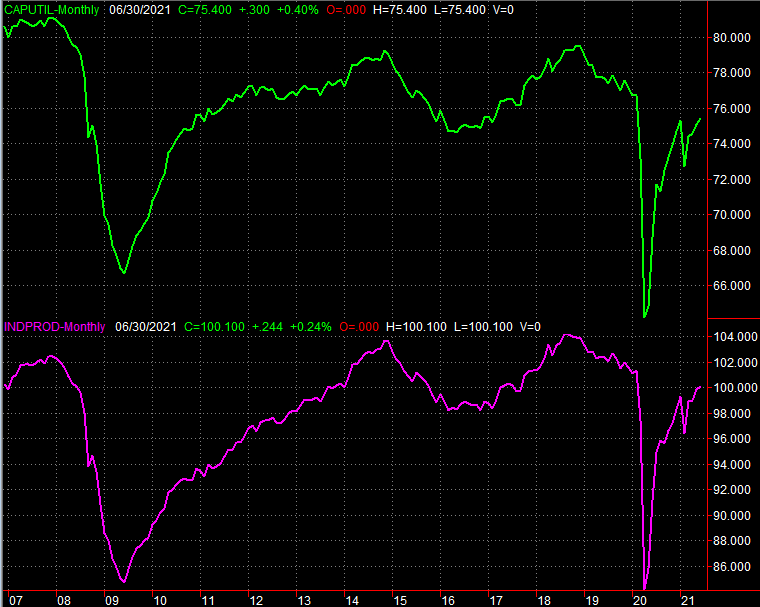
Source: Federal Reserve, TradeStation
This doesn't quite mix with consumer sentiment's weakening, but when the two themes contradict, what people are buying versus what they're feeling ultimately matters the most. The correlation between productivity, corporate profitability, and the market's long-term performance is pretty tight. Short-term market action? Not so much.
Either way, while we're still not back to pre-pandemic levels by either measure, the direction/trajectory is just as important -- and just as linked -- to the overall market's longer-term performance.
As for retail sales, the forecasts are calling for a significant slowdown from June's spending growth, with or without automobiles. Just bear in mind that spending has been unusually strong of late, so a slowdown would only carry consumption back to normalized levels.
Retail Sales Charts
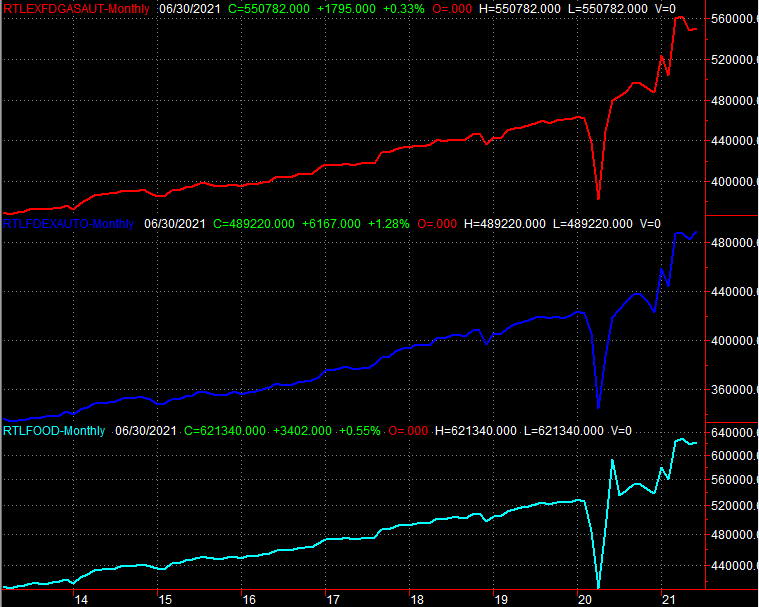
Source: Census Bureau, TradeStation
On Wednesday, we'll get last month's building permits and housing starts figures. The real estate sector needs a strong showing here, and while starts and permits shouldn't crater, they're not expected to soar, either. Like retail spending though, just keep in mind that the bigger trend here has been and is still technically bullish.
Housing Starts and Building Permits Charts
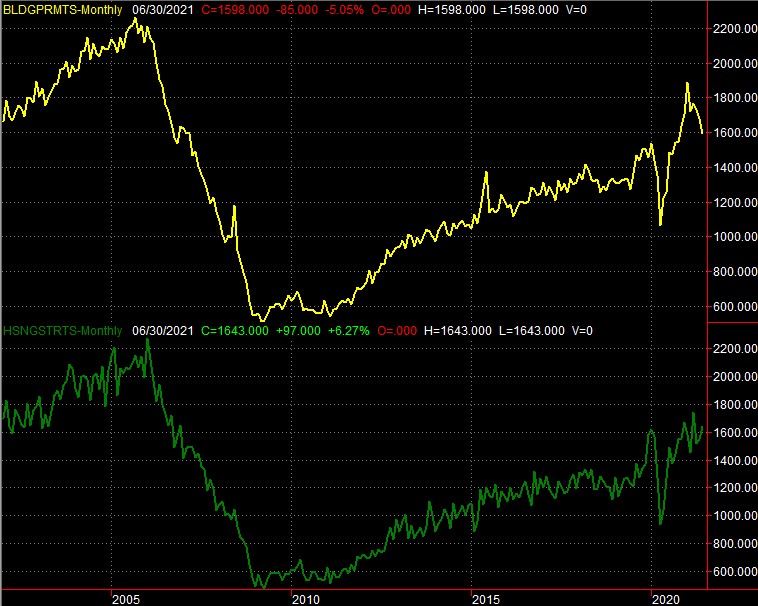
Source: Census Bureau, TradeStation
Also keep an eye/ear out on Wednesday for the release of the minutes from the most recent FOMC meeting. It's not a scheduled opportunity to change rates, and although the Fed's governors can decide to do so for emergency reasons, that's an unlikely move here.
Regardless, the minutes are important as they indicate how and what the FOMC is thinking about inflation and the general rate environment. Changes to the wording from the last set of minutes are usually key.
Stock Market Index Analysis
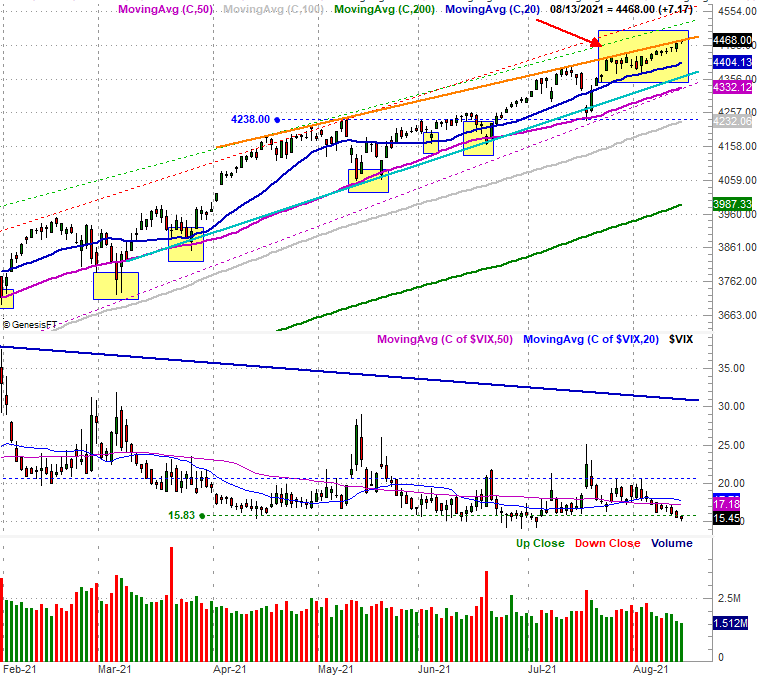
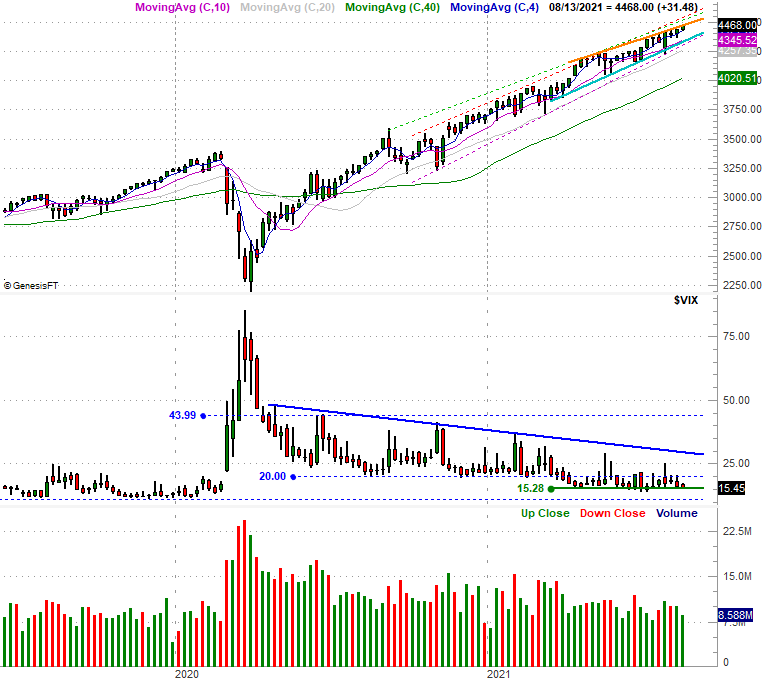
We kick this week's look off with a zoomed-in view of the S&P 500's daily chart, as this is where the market's most important matter is made clear - stocks are still making forward progress, but remain unable to hurdle the technical resistance line (orange) that connects all the key highs since April.
S&P 500 Daily Chart, with VIX and Volume
Source: TradeNavigator
Perhaps that's for the best in the long run. Nothing invites a little profit-taking like a market that's racing higher, and given our current circumstances, a little profit-taking could turn into a full-blown correction with relative ease. A slower pace is more sustainable.
Still, the daily chart gives us a couple of things to worry about. One of them is the VIX. It's back to "too low" levels. That's something we've said frequently in recent months, and it's ended up meaning nothing, as stocks have readily renewed their bigger-picture rally. One of these days though, the complacency being indicated by the "too low" VIX will mark the beginning of a sizable corrective move.
On that note, the other red flag we're seeing here underscores the idea that we're getting closer to that inevitable stumble. See the volume bars at the bottom of the chart above. The buying volume has been shrinking for some time, but was particularly poor last week. In fact, it's the lowest volume (and by default, the lowest bullish volume) we've seen since late-2019/early-2020. The buyers are losing interest. Actually, most have already lost interest.
Still, don't be too quick to try and time the exact top. This is a case where the smart move is waiting for the bears to prove they're actually going to do something destructive. The good news is that the make-or-break lines are pretty well-defined.
Although they're also plotted on the daily chart above, the boundaries of the rising wedge (orange and blue) that have been steering it higher since March, the weekly chart below really puts the narrowness of this rising wedge pattern in perspective.
Also take note of the fact that the 50-day moving average line (purple) is now more or less aligned with the lowed edge of the converging wedge pattern, at 4332. That's a huge line in the sand now. The S&P 500 will need to break under that floor before we can even start to assume the worst.
S&P 500 Weekly Chart, with VIX and Volume
Source: TradeNavigator
The weekly chart also tells us that while the VIX is indeed "too low" by some standards, it's certainly capable of moving even lower while stocks continue to climb. In the same vein as the S&P 500's technical support at 4332 needing to be broken before we need to sweat, the VIX actually needs to pop above its technical ceiling (blue) at 29.0 before there's a real reason to presume the 17-month rally is finally starting to unravel.
Curiously, the Nasdaq Composite's daily chart looks similar -- but not identical -- to the S&P 500's. Like its counterpart, the Nasdaq remains trapped under a technical ceiling (light blue) that connects all the major peaks since February.
But, that's not the ultimate ceiling. The real upper boundary here is currently at 16,400 (red, dashed), based on the pace at which the composite started to come out of the crash from early last year when the pandemic made landfall in the U.S.
Nasdaq Composite Daily Chart, with VXN
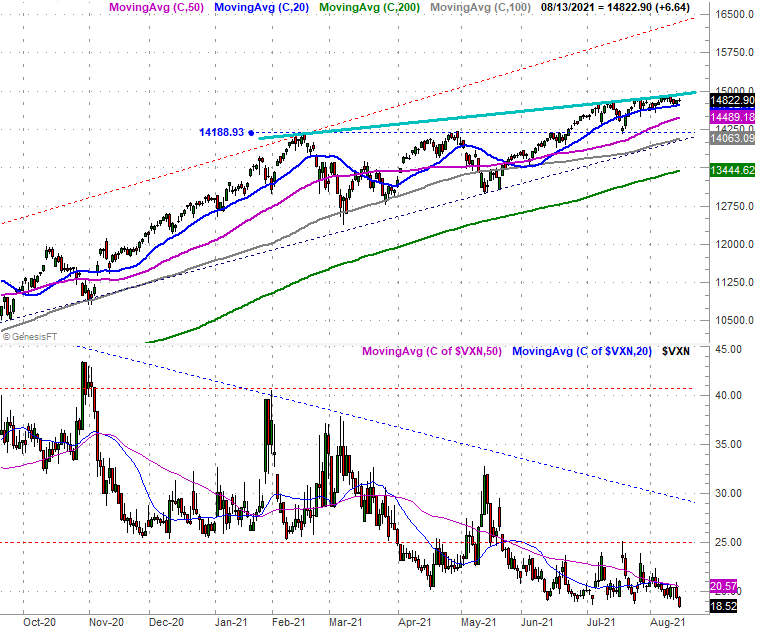
Source: TradeNavigator
This is good in the sense that it leaves lots of room for more upside should the Nasdaq be able to punch through its ceiling near 14,992. But, such an outcome seems mostly unlikely here.
More important right now, we want to watch where the Nasdaq is relative to its key technical floors. The biggie is at 14,066, where the 100-day moving average line (gray) intersects with the floor (dashed) that connects all the key lows since late last year. As long as the composite holds above that level, the rally remains alive.


