
Weekly Market Outlook - Pullback Averted For Now, But Gains Still Weigh
Not bad. The market was dancing with the idea of a pullback, logging three straight days of lower highs after Monday's pop. When they had to make the tough decision headed into the weekend though, investors felt the biggest risk was not being in the market. Friday's gain of 0.69% left the S&P 500 at its highest close since early November.
Still, there's good reason to worry that the rally - at least this leg of it - is coming to an end. Whether or not we 'reset' and renew the rally without taking on too much damage depends on what happens this week.
We'll weigh it all below, as always, after running down last week's economic announcements and previewing this week's economic news.
Economic Data Analysis
It was sometimes difficult to notice, between dueling political stories form Vietnam and Washington DC. But, last week was unusually busy in terms of economic news, with the federal government finally able to play 'catch up' with some of the reports that had been postponed due to the government shutdown. We'll have to limit our look to the highlights, and examine them in order of appearance.
That order puts December's housing starts and building permits at the front of the line. The numbers were less than thrilling, though bear in mind they're December's numbers, when it looked relatively certain a shutdown was imminent. Psychology might have played a role.
Housing Starts and Building Permits Charts
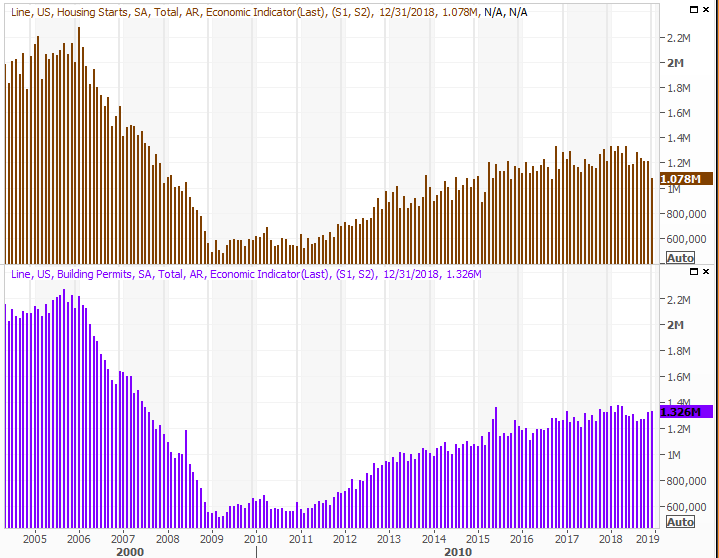
Source: Thomson Reuters
We also got updates on home prices early in the week, from the Case-Shiller report as well as the FHFA. Not surprisingly, the growth rate did slow, but that may have been more a function of recent red-hot growth than a sign of fading demand.
Home Price Index Charts
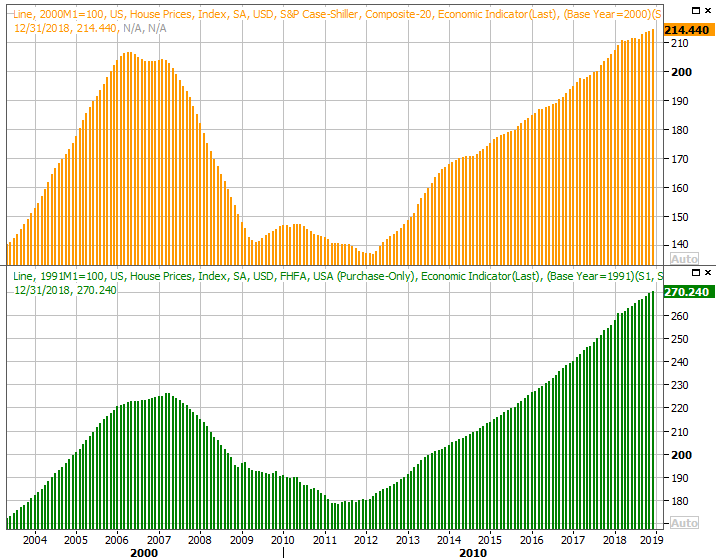
Source: Thomson Reuters
Curiously, on Tuesday we learned the Conference Board's measure of consume confidence jumped from 121.7 to 131.4 in February, coming in well above expectations. It's an encouraging sign that, despite all the political bickering and the doomsday prophecies being touted about the market, the people who actually drive the economy (and stocks) aren't terribly worried.
Consumer Sentiment Charts
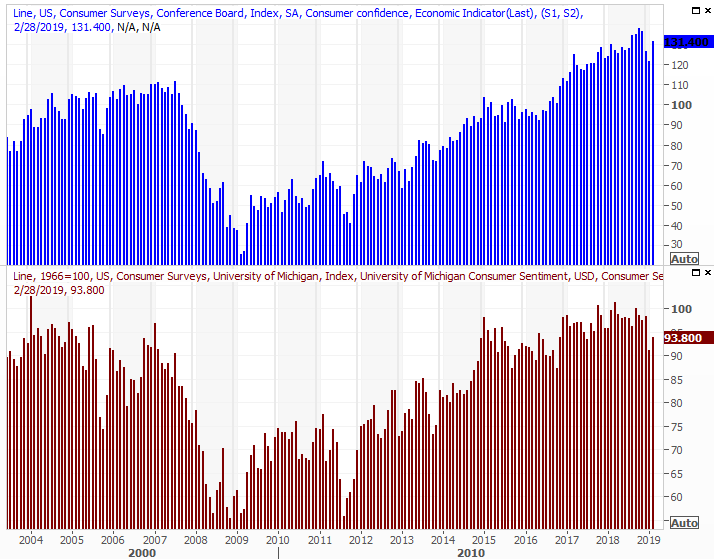
Source: Thomson Reuters
Note, the Michigan Sentiment Index reading posted later in the week dropped slightly from its previous reading, but was still up from January's score.
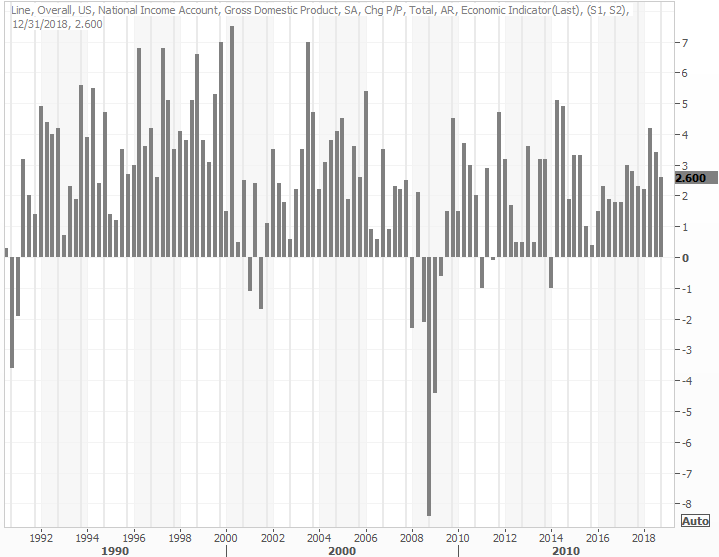
On Thursday we heard the first (of three) reports in Q4's GDP growth rate. It did slow, mostly as expected, to 2.6%. It's not a bad reading. It's down from stronger paces seen earlier in the year, but all things considered, it's serviceable.
GDP Growth Rate Charts
Source: Thomson Reuters
The GDP figure is subject to revisions, but it rarely changes much when the number is updated.
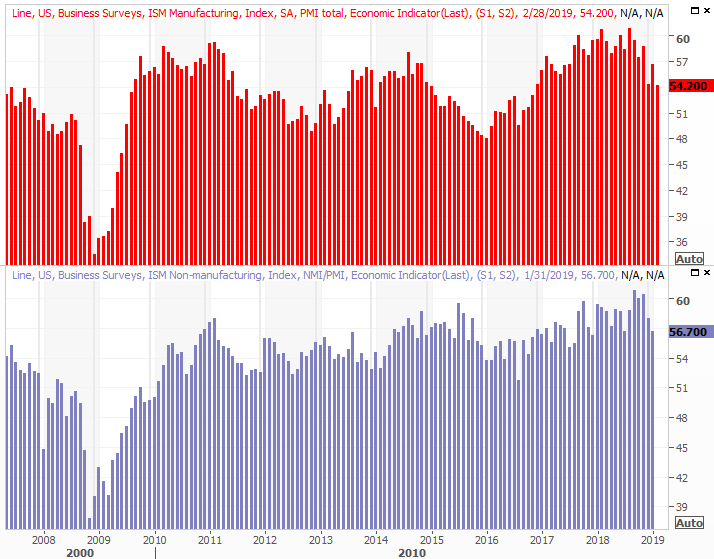
The ISM Manufacturing Index score came in at 54.2 for February. That's actually down from January's level, though not by much. More important, it's another layer of evidence that despite all the rhetoric, the nation's factories are still humming.
ISM Index Charts
Source: Thomson Reuters
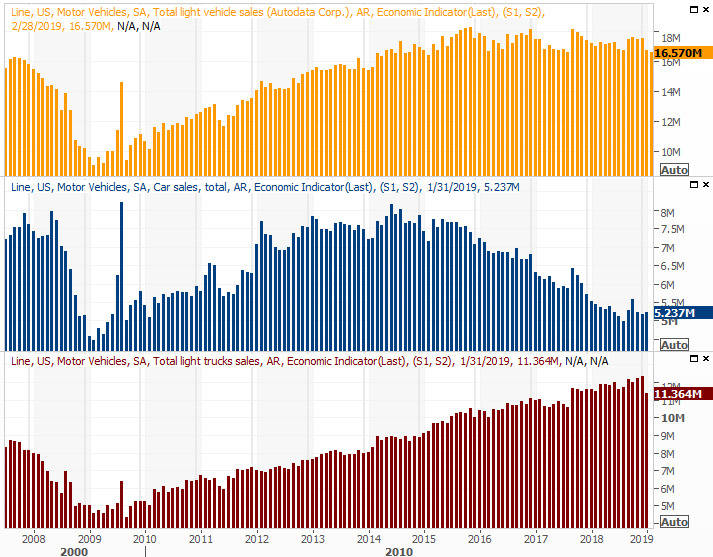
Finally, last week also gave is last month's automobile sales report. They weren't great, falling to the slowest pace in a year and a half. Worse, that extends a streak of weakness, and worse than that, it was the usually strong truck category that lost ground. Sedan sales actually seem to be picking up.
Automobile Sales Charts
Source: Thomson Reuters
The ISM Services Index will be updated this week. Everything else is on the grid.
Economic Calendar
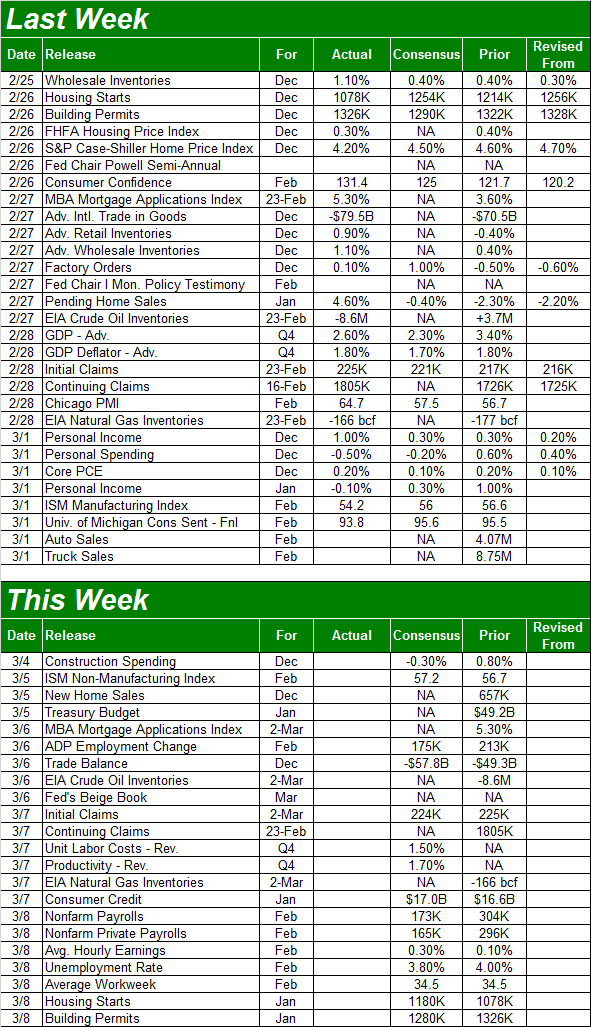
Source: Briefing.com
Aside from the ISM Services Index update slated for Tuesday (expected to be up, by the way), also watch for Wednesday's trade balance report. It's actually not all that important, unless the two political parties want to use it as a weapon.
This week's biggie, of course, is Friday's employment report for February. It will be interesting to see if there was any real fallout from the government shutdown that lingered into the following month. If there is, it should be short-lived, given strong consumer confidence levels and persistently high manufacturing activity. But, we'll see.
Payroll Growth, Unemployment Rate Charts
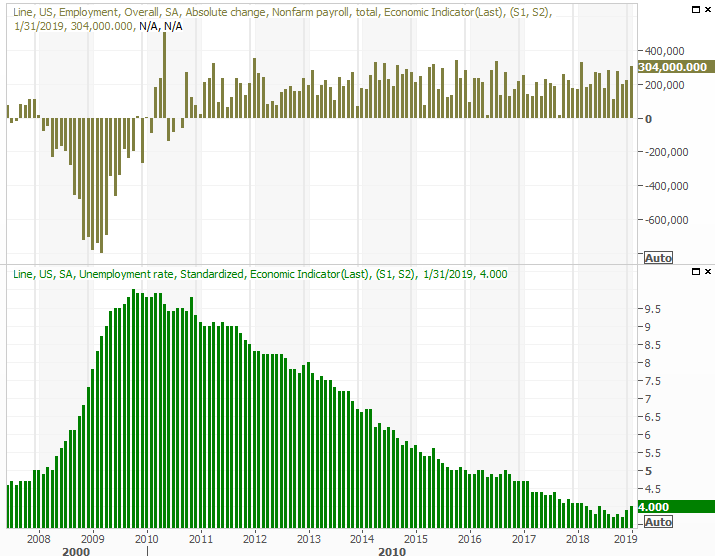
Source: Thomson Reuters
Stock Market Index Analysis
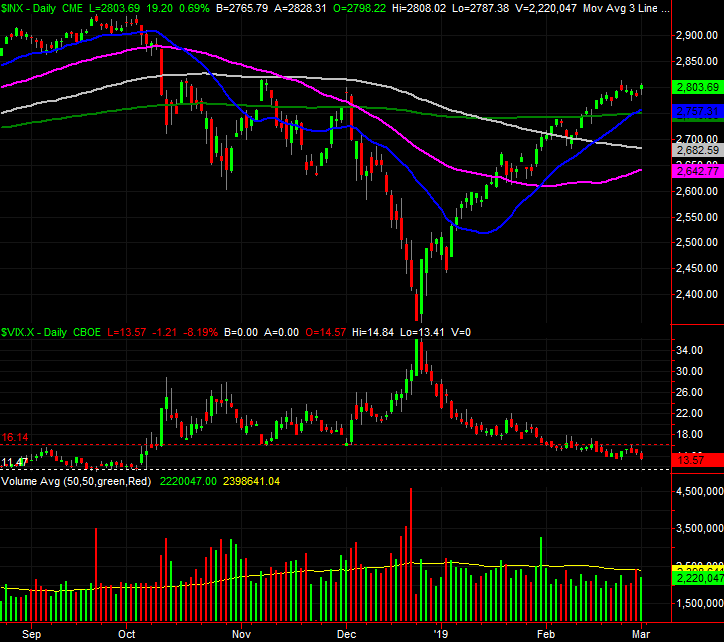
There's no getting around the reality that stocks are due for a cooling. But, so far, the bulls haven't even been willing to let the market even slide just a little bit. The S&P 500 is now up 19.5% from the late-December low... a rally that's been mostly uninterrupted.
Take a look at the daily chart of the S&P 500. It crossed back above the last of the key moving average line - the green 200-day moving average line - and managed to remain above it last week. While that doesn't guarantee stocks can't make a good-sized pullback from here, the longer it can remain above the floor, the more likely investors will be willing to keep it near its current levels in the event of a pushback.
S&P 500 Daily Chart, with Volume
Source: TradeStation
It's not the ideal situation for the bulls, for a couple of reasons. One of them is the fact that the VIX's close at 13.6 on Friday leaves it uncomfortably close to a more absolute floor around 11.50. That leaves stocks a little more plausible room to keep moving higher, but not necessarily a whole lot higher.
The other reason? Despite the continued gain through Friday's close, the volume behind the rally remains less than robust.
Not so with the NASDAQ Composite, where it really counts.
It's been explained before but merits a revisit now... the NASDAQ Composite leads the market higher and lower. Its current looks much like the S&P 500's, but with more bullish volume.
NASDAQ Composite Daily Chart, with Volume

Source: TradeStation
The graphic below breaks out the NASDAQ's advancers and decliners, and its up volume and down volume; the black moving average lines overlaid on each data set make clear that on Friday, breadth and depth were decidedly bullish. Yet, even earlier in the week the NASDAQ's breadth and depth weren't overwhelmingly bearish.
NASDAQ Composite Daily Chart, Advancers/Decliners, Up/Down Volume
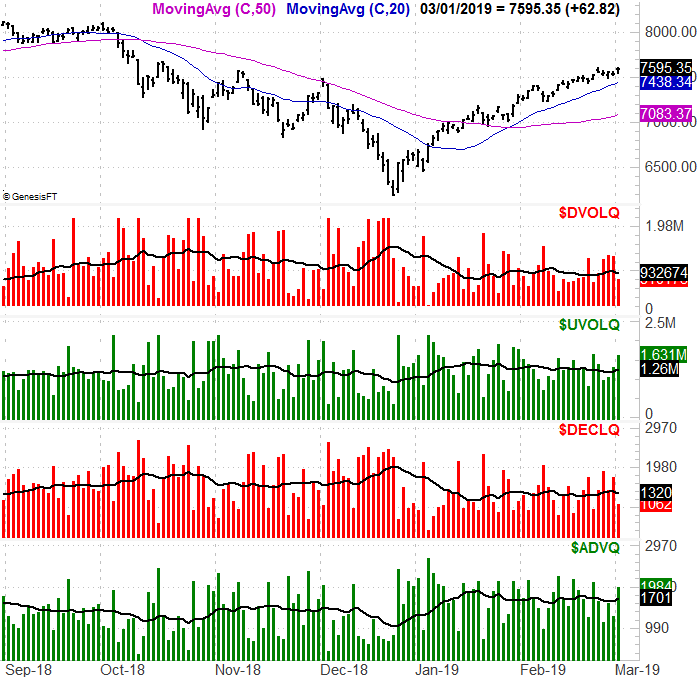
Source: TradeNavigator
Still, the NASDAQ's volatility index, the VXN, is getting uncomfortably close to a floor around 14.9... a reality made clear from a weekly perspective. The weekly chart also shows is something else: The composite has dished out a 22% gain from the late-December low, and wasn't ever really checked on the way up. Even as rough as the October-December meltdown was, it at least took a couple of breaks in there.
NASDAQ Composite Weekly Chart, with Volume
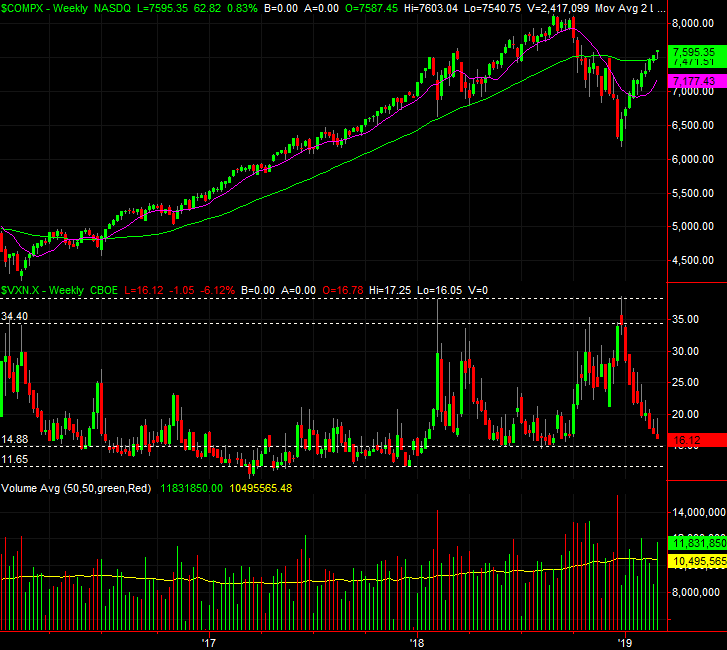
Source: TradeStation
And for what it's worth, though not shown on any chart here, the S&P 500's daily chart just signaled a bearish divergence of the MACD indicator. More on that next time.
Despite Friday's victory, stocks are still uncomfortably vulnerable here. Yet, the technicals matter a little less now than they usually might. This is still a market being largely driven by headlines - and political headlines in particular - and we have to be prepared for anything. Most of all we need to be prepared to respond to what the market IS doing rather than what we think it should be doing. Strange days indeed.


