
Weekly Market Outlook – The Selling Has Taken On A Life Of Its Own
The market almost found a way to kickstart a recovery... almost. Though up for the week as of Thursday thanks to Monday's pivotal bar, the bulls changed their mind on Friday. Too scared to remain exposed to stocks headed into the weekend, that 1.9% setback left the S&P 500 down to the tune of 1.25% for the week. The close of 2599.95 was the lowest close since March.
It may well portend of things to come. Yet, a careful and closer look at all the data doesn't indicate that the sellers truly fear what lies ahead. Mostly it looks like traders afraid of more selling, which ironically could be causing the very thing they fear.
Regardless, there's no extra credit for standing in front of a train or being a martyr just to make a point.
We'll dissect the meltdown below, which unfortunately is gaining momentum. Before we get to that analysis though, let's run down last week's economic news and preview this week's economic announcements.
Economic Data Analysis
It wasn't an overwhelming week in terms of economic news, but it was certainly a busy one. More important, the reports we got all suggest the economy is in a Goldilocks zone... not too hot, not too cold. It's good enough to facilitate earnings growth, but not so strong that the Fed has to be hawkish with its rate-hike plans.
First and foremost, know that inflation is tempered. Tuesday's producer inflation data as well as Wednesday's consumer inflation for November were both as tepid as expected. 'The' annualized inflation rate now stands at 2.2%, essentially in line with the Fed's target.
Producer, Consumer Inflation (Annualized) Charts
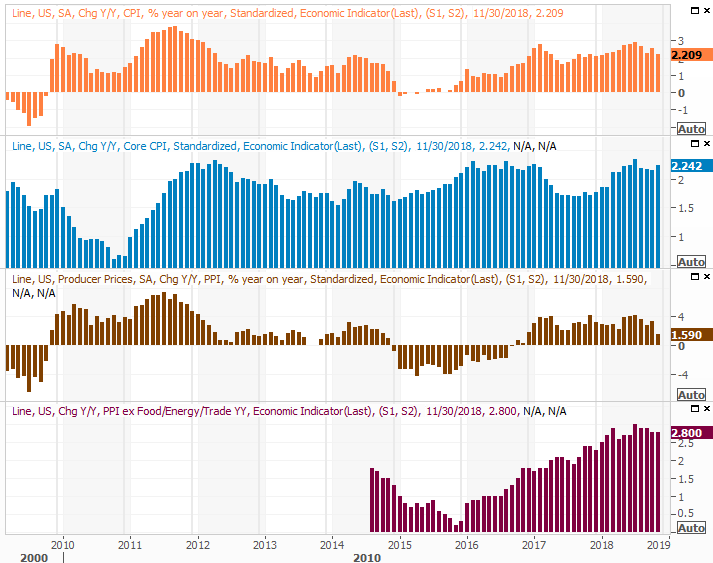
Source: Thomson Reuters
This leaves the FOMC plenty of room to maneuver, though most investors seem to think the economy may be beyond help.
Consumers are also still spending in stores. Though spending slowed dramatically from October's 1.0% growth, the 0.2% rise was right on target. Year-over-year we're still seeing spending growth of more than 4.0%, in all stratifications.
Retail Sales Charts
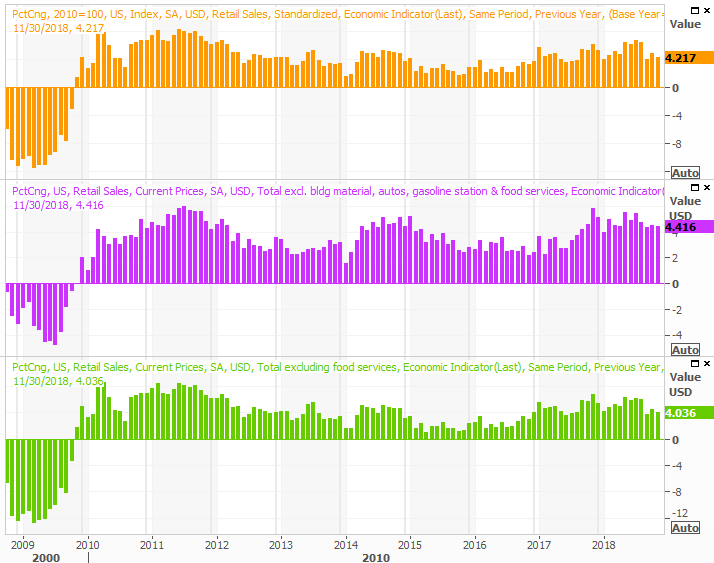
Source: Thomson Reuters
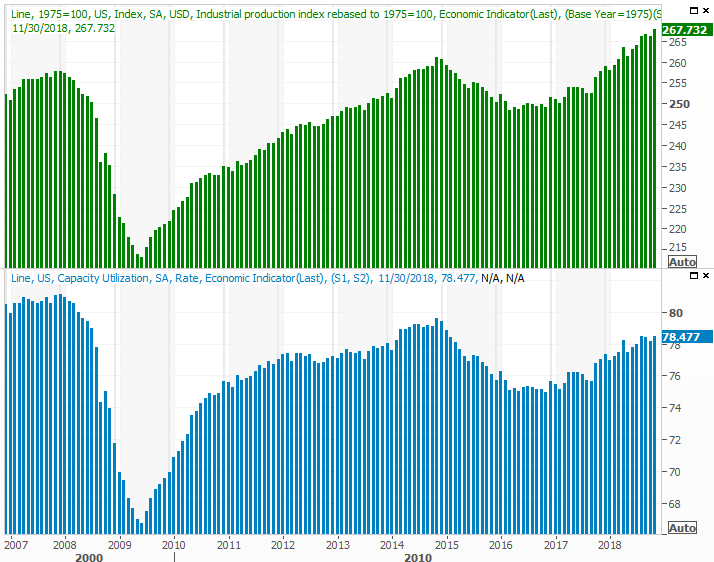
Finally, and arguably most important, capacity utilization and industrial productivity were both up last month, pointing to more industrial activity as well as profit growth.
We've mentioned it before but it bears repeating now... this data coincides with the long-term market trend and corporate earnings. If it's still rising, the bull market is still alive and the economy is still growing. It won't stave off short-term pullbacks, but it's a bullish bigger-picture clue.
Capacity Utilization, Industrial Productivity Charts
Source: Thomson Reuters
Everything else is on the grid.
Economic Calendar
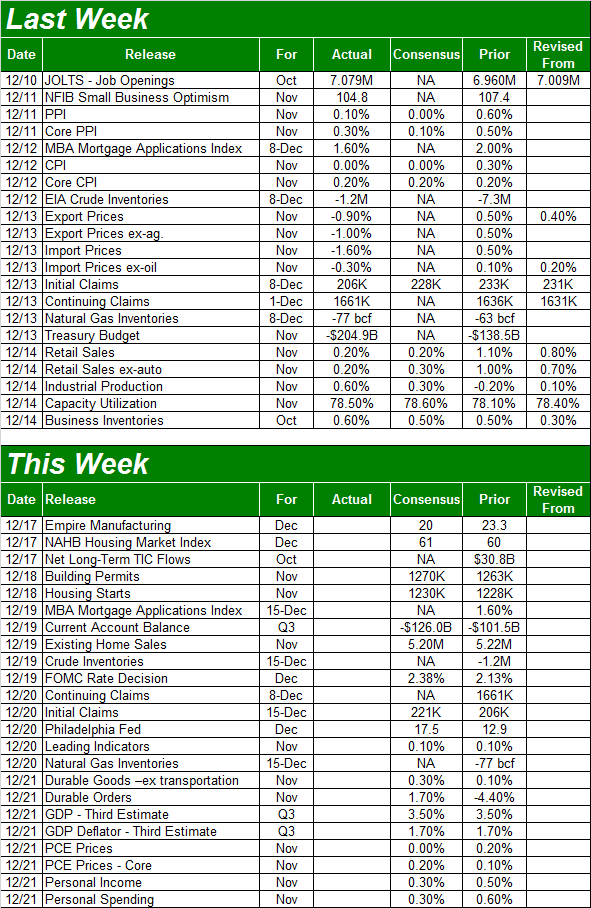
Source: Briefing.com
This week will be rather busy as well, particularly in terms of real estate data.
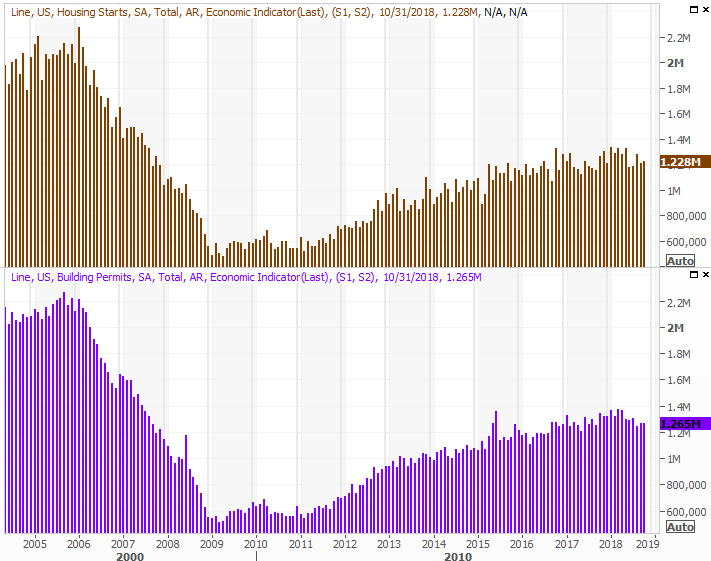
On Tuesday we'll get last month's housing starts and building permits report. Economists are looking for a slight uptick on both fronts, but that's something of a problem as both have been trending downward since early in the year.
Housing Starts and Building Permits Charts
Source: Thomson Reuters
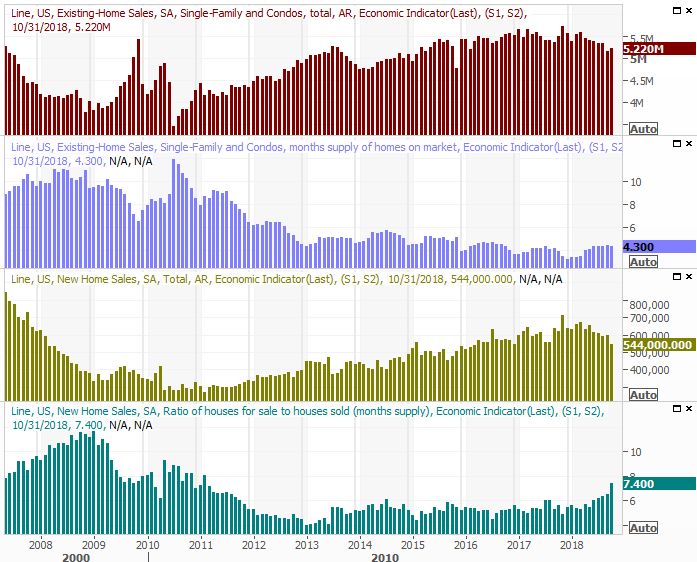
On Wednesday we'll hear November's existing homes sales figure; the pros are calling for a slight dip, to an annual pace if 5.2 million. We won't hear the new-home sales report until next week, but both have been trending lower for some time now.
New and Existing Home Sales Charts
Source: Thomson Reuters
Also in Wednesday the Federal Reserve will make an important decision about interest rates. As of the latest look traders are saying there's a 75% chance we'll see a quarter-point hike. Either way, it's going to be a well-watched report, and the market's sure to respond firmly one way or another.
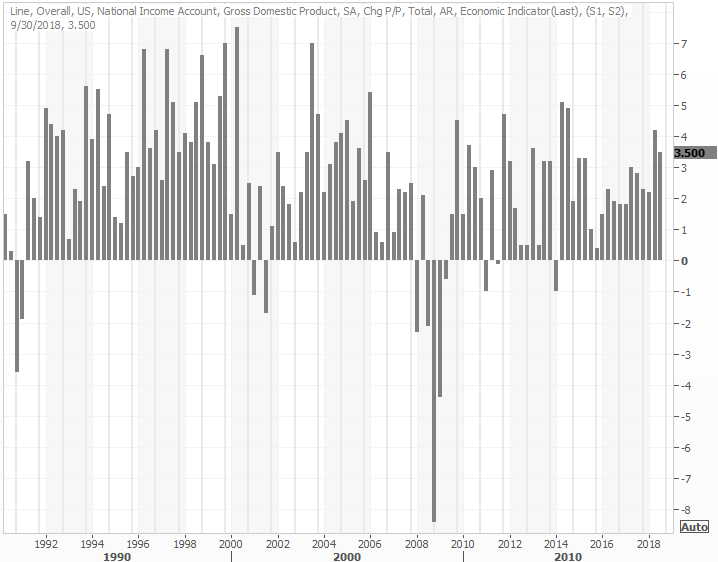
Finally, on Friday look for the third and final estimate of Q3's GDP growth rate. Economists still believe it grew at a 3.5% pace, as was estimated last month. This remains one of the most consistently robust economies we've seen in years.
GDP Growth Charts
Source: Thomson Reuters
Stock Market Index Analysis
If you're struggling to identify the true reason stocks are struggling so much right now, you're not alone. Plenty of reasons like a trade war with China and an inverted yield curve are being highlighted, but earnings are still growing. So is the economy. The most realistic reason the market's falling here is because (all joking aside) the market is falling. A whole slew of investors are simply adhering to the script they think they've been given.
Of course, that's still enough to keep things moving lower.
For the record, the meltdown is now officially much worse than the one we saw in February and March. That pullback was an 11.3% stumble from high to low, and this one's now given back 11.6%. Worse than that, we've seen several bearish moving average crossunders within the past month, including the so-called 'death cross.' We detailed the true statistics of those crossunders at the site, and history says stocks will be fine a few months from now. The 'in the meantime' could still be torturous though.
S&P 500 Daily Chart, with Volume
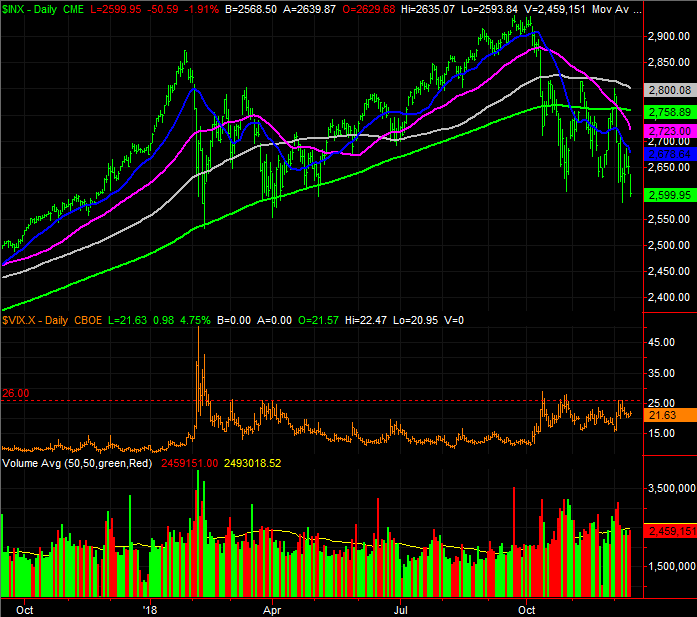
Source: TradeStation
Applying conventional technical analysis is a bit dangerous right now, or at least a middle misleading. Sentiment has hijacked the market, and though that sentiment is picking up steam and self-fueling the weakness, we have to keep the prospect of an unexpected bounce in our back pocket.
With that as the backdrop, it's not so much what's happening but what's NOT happened yet that worries us even more than the brewing bearish momentum. We've not yet seen the VIX jump to multi-week or even multi-month highs that coincide with major lows. We would have thought we'd have seen it by now, but the market's not had that blowout moment yet.
Ditto for the NASDAQ Composite and the VXN. This is an ugly picture, but more than that, it's become a self-feeding selloff with no reason to think an end is in sight.
NASDAQ Composite Daily Chart, with Volume
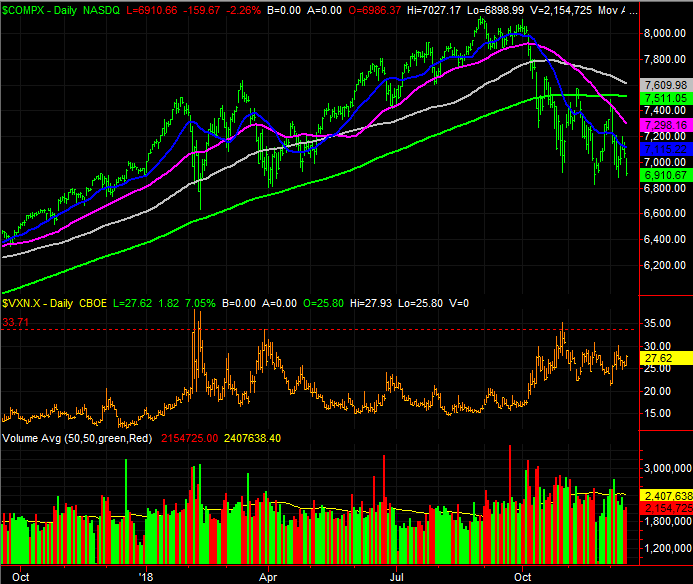
Source: TradeStation
If the market is going to make a major bottom here, something significant is going to have to change between investors' ears. Without that, the only other alternative is to let stocks keep drifting lower while we wait for the VIX and VXN to finally surge.
That could be a frustrating wait as well though, as most of the stock-selling that needs to be done has already been done. As of the end of last month, exposure to equities in investor portfolios was as low as it's been in nearly three years as of November. It appears there's too much pessimism in place right now, even if the VIX doesn't suggest that's the case.
Like we said, this is odd, not because it's tricky to read the subtle clues not because we don't understand them, but because they're sending us a mixed message.
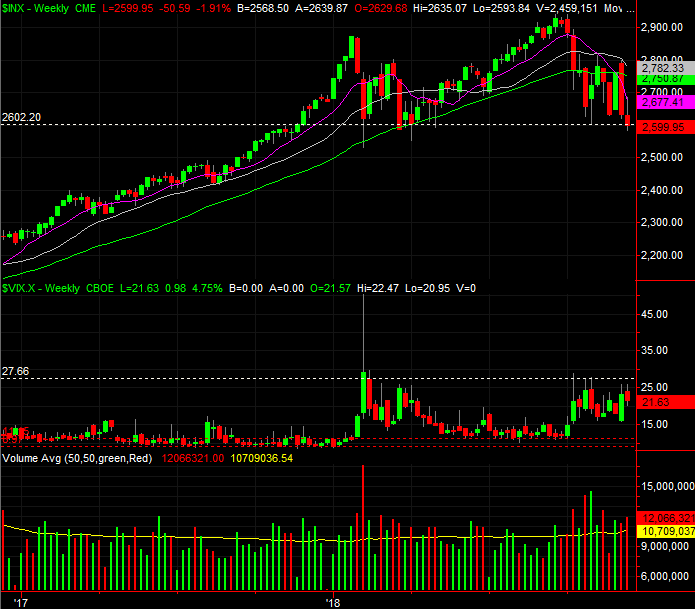
Zooming out to a weekly chart of the S&P 500 may make matters even more confusing. It's encouraging that the current lows are more or less in-line with the lows from the February/March stumble. But, the selling volume now is growing at a pretty good clip. The selling volume than was shrinking the whole time. (It's also on the weekly chart we can see that despite the market's decided move to lower lows, the VIX has been oddly capped around 27.
S&P 500 Weekly Chart, with Volume
Source: TradeStation
If the current floor doesn't hold up as a floor, that may well accelerate the wave of selling. The irony is, without a recession or even shrinking earnings to justify such a plunge, such a setback will be a huge buying opportunity. Nobody's going to believe it or say it at the time.
We'll see how it shakes out. This is going to be a very telling week.


