
Weekly Market Outlook – The Lack Of Last-Minute Heroics Last Week Is Telling
The bulls gave it a good go, but the rebound effort that took shape early last week petered out pretty quickly -- right where resistance could have been expected. This time though, the bulls didn't stand up to the selling.
All the technical floors that were in place this time failed to do the job. It was a modest break below key technical floors, but in some regards, that's even worse than a sharp meltdown. (A steep selloff can set up a quick rebound. A slow, meandering selloff can firm up and get going in earnest before anyone even realizes it's happening.)
We'll take a close-up look at the matter below. First, let's recap last week's big economic news and preview what's in the cards for this week.
Economic Data Analysis
The U.S. economy is recovering, but that rebound lost some momentum this month now that the easy part of the recovery is done. The nation's factory output improved 40 basis points last month following the improvement of 3.5% points in July.
Capacity utilization grew from 71.1% to 71.4%, but economists were calling for 71.7%. This is serviceable, but this "leveling-off" isn't anywhere near pre-COVID-19 levels. We'll need to do much better to achieve self-sustaining economic growth.
Capacity Utilization and Industrial Production Charts
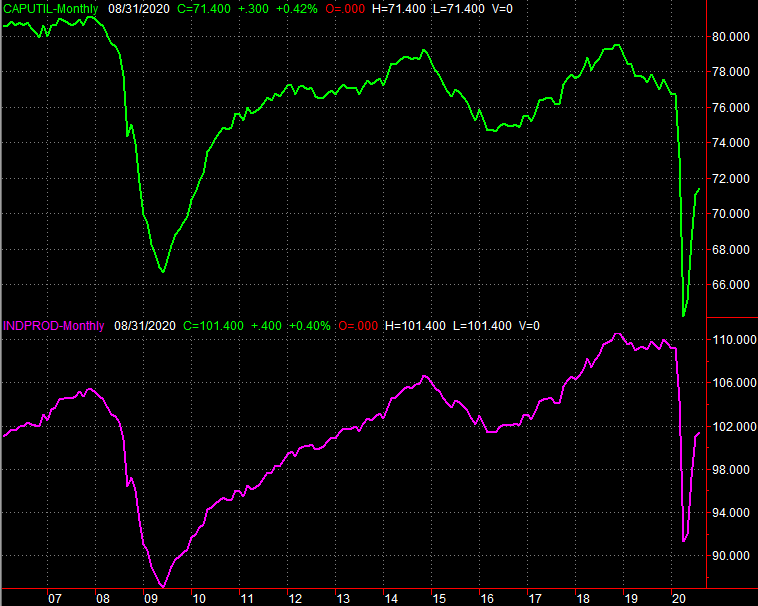
Source: Federal Reserve, TradeStation
In the same sense, retail spending continues to grow, but that growth pace is slowing. Retail spending was up 0.6% from July's adjusted levels, or up 0.7%, not counting cars. Analysts were modeling a 1.0% increase for both. Again, this is a step in the right direction, but it's not quite strong enough given the circumstances.
Retail Sales Charts
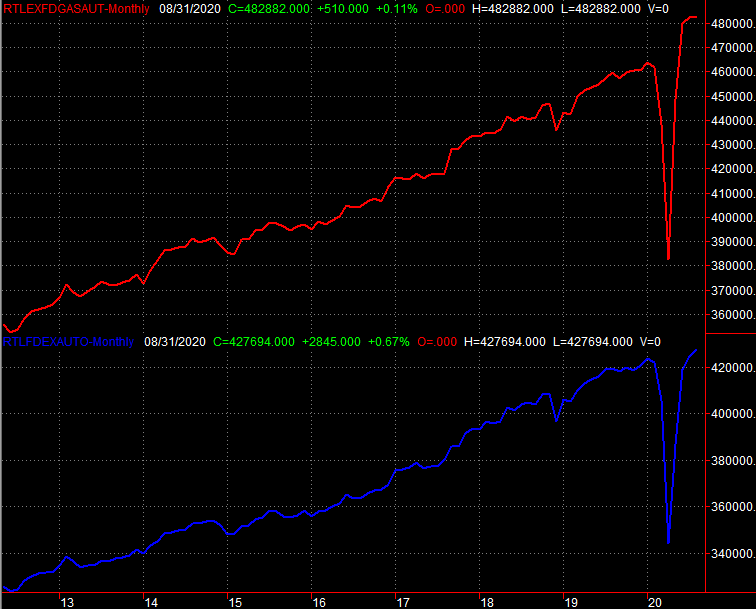
Source: U.S. Census Bureau, TradeStation
A lot of this tepidness reflects the fact that many people are still unemployed or underemployed.
Finally, last month's building permits and housing starts - like industrial production and consumer spending - were modest. The annualized pace of permits fell from 1.483 million to 1.47 million, and starts slipped from 1.492 million to 1.416 million. The pros were modeling better numbers.
Housing Starts and Building Permits Charts
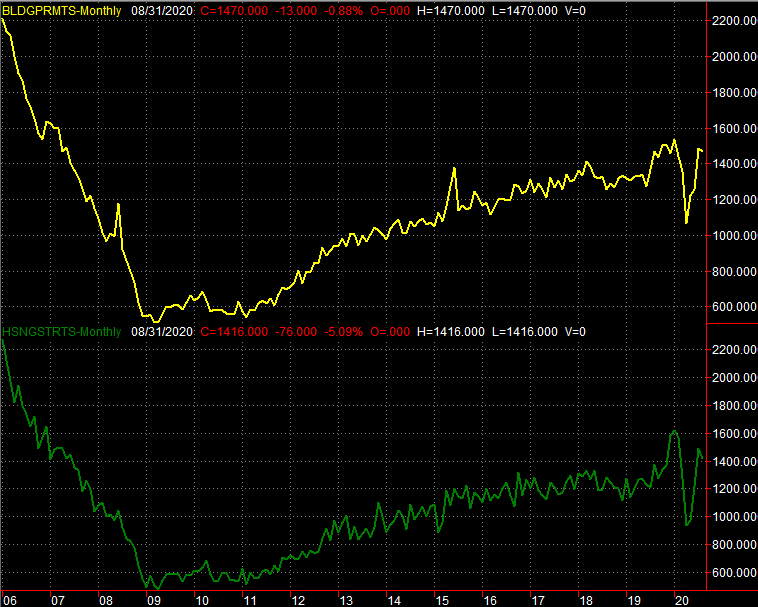
Source: U.S. Census Bureau, TradeStation
Do note, however, that even with last month's building lulls, current levels more or less align with the growth trend that first started to take shape in 2011. Everything else is on the grid.
Economic Calendar
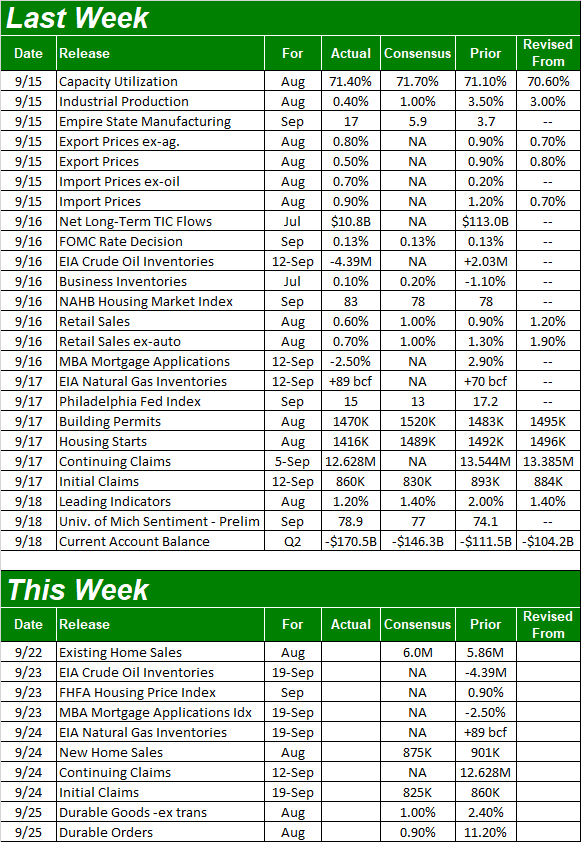
Source: Briefing.com
This week will further flesh out the real estate picture, with a look at new and existing home sales, as well as the FHFA Housing Price Index. New home sales are likely to taper off, but return for a huge surge in July. Sales of existing homes are projected to improve slightly, reaching an annual pace of 6.0 million. Where starts and permits lag, it's being offset here.
New Home Sales Chart

Source: U.S. Census Bureau, TradeStation
Tepid starts and permits have also been somewhat offset by decent home prices. There's no published estimate yet for the most recent change of the FHFA Housing Price Index. Ditto for the comparable Case-Shiller Home Price Index slated for release next week. Both seem to be holding up despite a little turbulence as of late.
FHFA and Case-Shiller Housing Price Index Chart
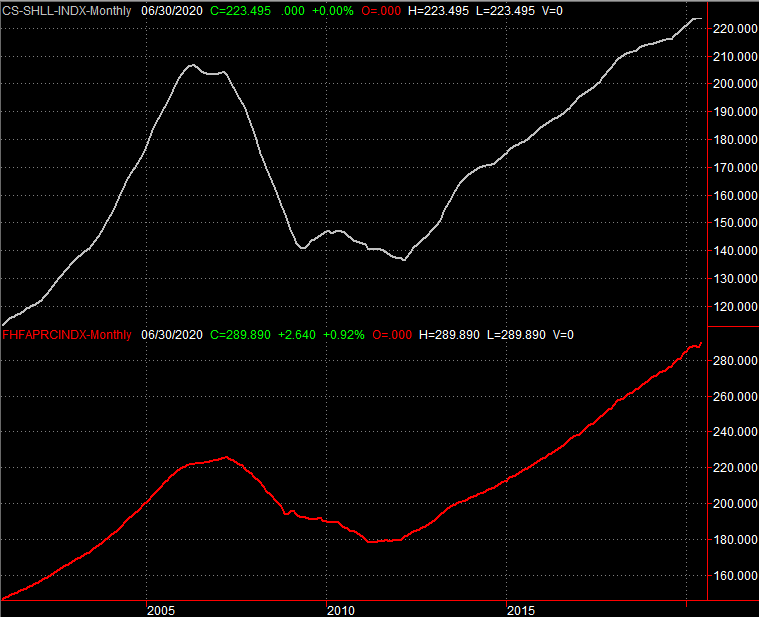
Source: FHFA, Standard & Poor's, TradeStation
Stock Market Index Analysis
The daily chart of the S&P 500 says it all. The index tested its 20-day moving average line (blue) at 3424 for a second time in as many weeks last week, and for a second time, was unable to clear it. In fact, all it had to do was kiss that short-term moving average line to spark another pullback.
Only this time, the 50-day moving average line (purple) failed to prop the index up. Friday's close of 3319.47 was below the 50-day line -- the first close below the 50-day moving average since April, when the S&P 500 was en route back above the 50-day line.
S&P 500 Daily Chart, with VIX and Volume
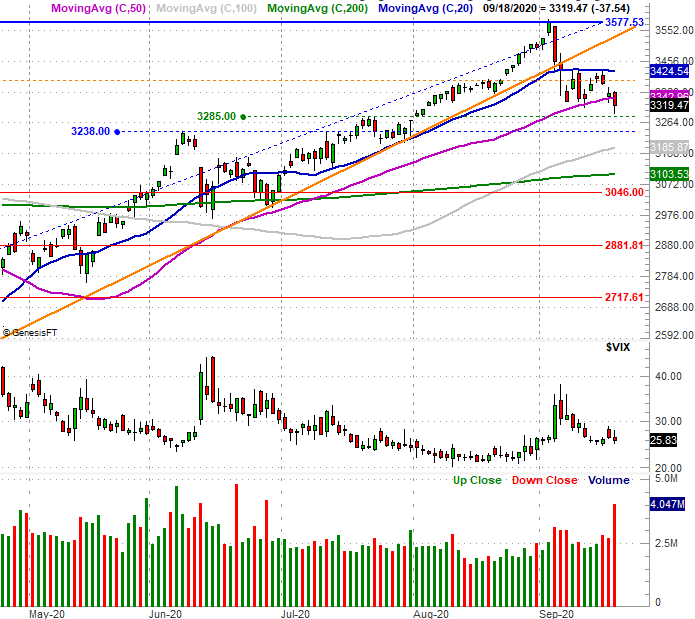
Source: TradeNavigator
The strange part? The VIX didn't skyrocket. The day was, at the very least, concerning; at most it could have been alarming. Yet, traders didn't seem too surprised or terribly upset. That, in some ways, is more concerning than a VIX spike would be. It (tacitly) suggests those traders may have already been planning on a pullback. That in turn suggests one may already be in the works as a self-fulfilling prophecy.
The daily chart of the NASDAQ Composite says the same, though perhaps, it already points to even more damage. The NASDAQ's closed below its 50-day moving average line three times since a week ago, and on Friday, it appeared to find resistance at the 50-day moving average.
NASDAQ Composite Daily Chart, with VXN, Up and Down Volume
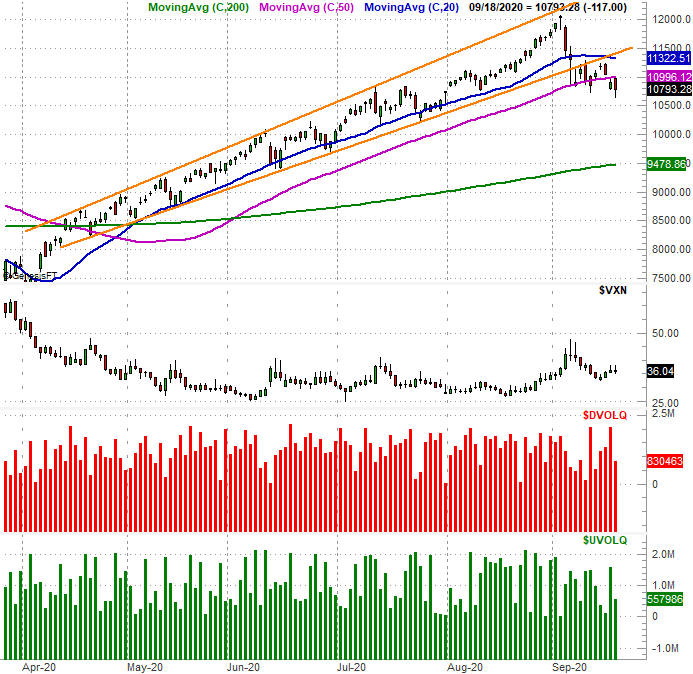
Source: TradeNavigator
It's a red flag in that the composite tends to lead the rest of the market up and down.
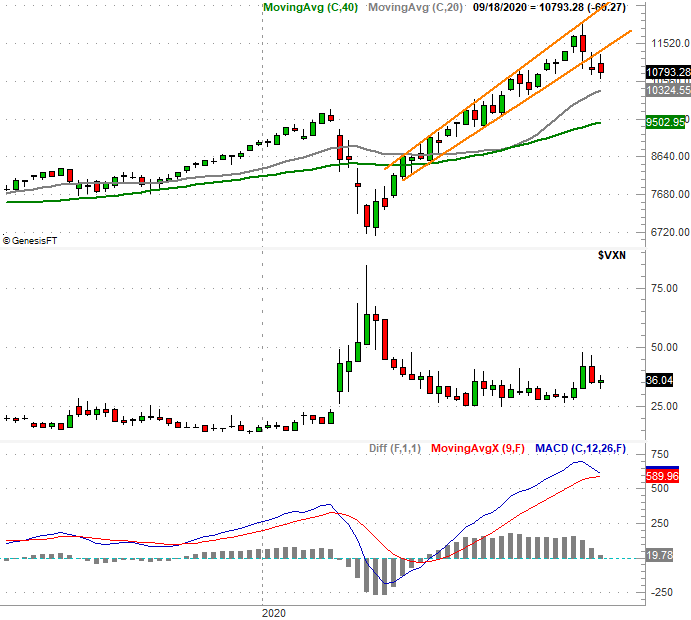
The weekly chart adds more perspective to the matter. It's in this timeframe that we can see the NASDAQ was already below the rising channel - framed in orange - that had been guiding the composites high since April. This vantage also shows us just how overbought the index was from its incredible 70% rally from March's low. There's still room and reason for more selling. Also note that we're nearing a bearish MACD condition.
NASDAQ Composite Weekly Chart, with VXN and MACD
Source: TradeNavigator
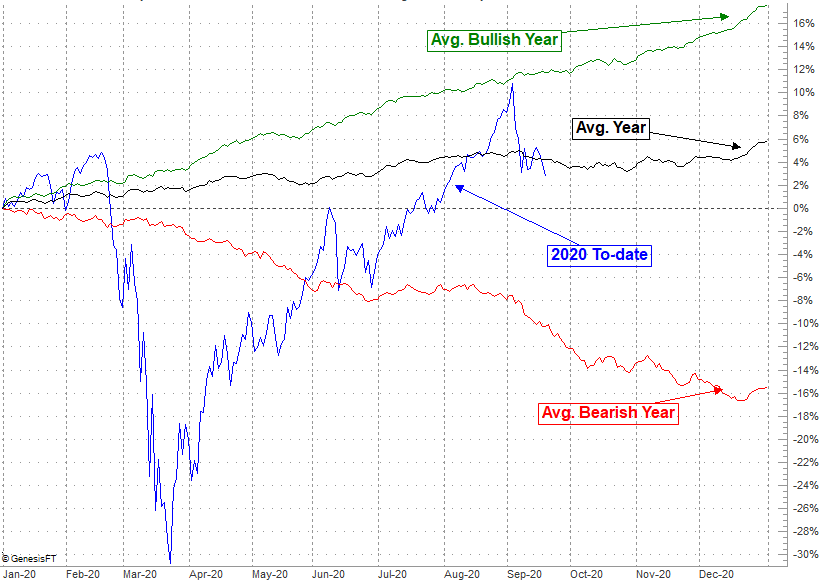
The calendar is also (still) working against stocks. While the COVID-19-related volatility from early this year for the most part wrecked any meaningful comparisons, things have returned to "normal" in recent weeks now that it's become clear the coronavirus contagion doesn't have to shut the global economy down. Stocks have eased back into a familiar groove, but with the extent they've done so, we're now back to a tough time of the year.
September and the first half of October tend to be weak, setting up a year-end rally. The S&P 500 is now more or less where it would be in an average year. Given the selling momentum established this month and the fact that stocks are still technically overbought, it's not unreasonable to worry that the market will sink more from here and set up an above-average recovery for November and December.
S&P 500 Day-to-Day Average Annual Performance
Source: TradeNavigator
It all makes this week an important one. The bulls may have one last chance to stave off more selling, but they have to get stocks back above their 50-day moving average lines. The longer the indices are allowed to linger at present levels, the more likely it is the bulls still around will decide to throw in the towel and wait for the next major market bottom.


