
Weekly Market Outlook – The Bulls Held The Line Where They Absolutely Had To

Stocks lost ground last week, as the previous week's action suggested would be the case. The market didn't break below the key floors that had to remain intact, however, keeping stocks in the hunt for a renewal of the rally that got rolling in late September. Traders seem to still be counting on a stimulus package coming through sooner or later... sooner than later.
The major market indices are just one bad day away from a pretty significant breakdown though, and given all the political uncertainties in place at this time, traders need to be ready for all contingencies.
We'll look at the prospective upsides and downsides below, as usual. First though, let's look at last week's big economic announcements and preview what's on the dance card for this week.
Economic Data Analysis
There wasn't really a lot to think about last week, although it was a pretty big week for real estate. We got last month's existing home sales, as well as last month's housing starts and building permits. In short, home-buying and home-building remain pretty strong. Starts improved to an annualized pace of 1.553 million, topping expectations, and permits of 1.415 million didn't quite meet expectations, but easily cleared August's pace of 1.388 million. Both figures are among the best we've seen in years, and point to at least solid demand for housing in spite of COVID's impact, though starts aren't quite back up to late-2019's levels.
Building Permits and Housing Starts Charts
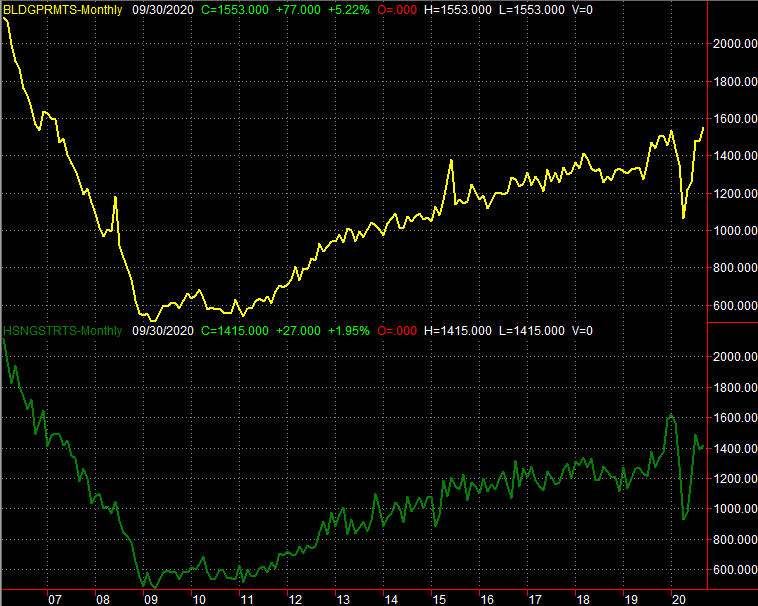
Source: Census Bureau, TradeStation
In the same vein, sales of existing homes soared to a pace of 6.54 million, easily exceeding the expected 6.1 million. We'll get new home sales data this week -- more on that below. Everything else is on the grid.
Economic Calendar
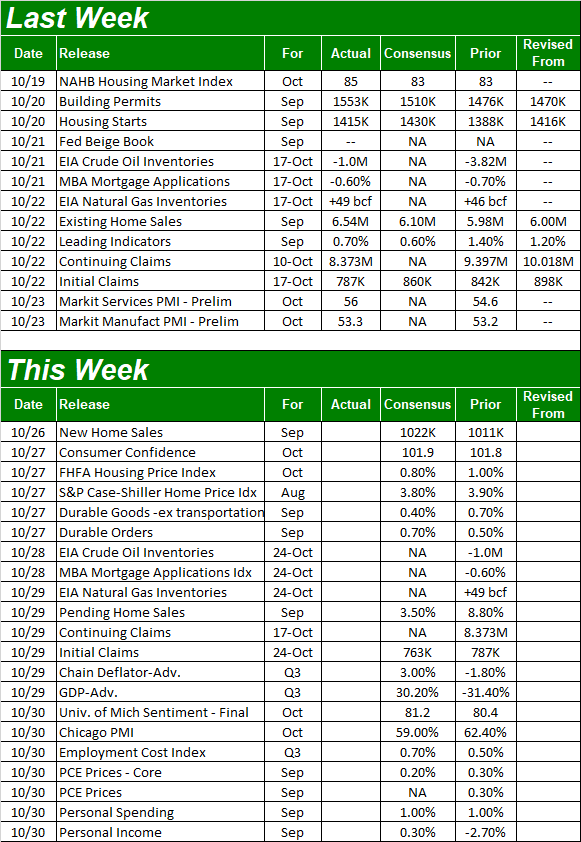
Source: Briefing.com
As was noted, this week we'll hear about last month's new home sales. Existing home purchases were up firmly, and economists are modeling for a similarly strong print on the new home sales front... an annualized pace of 1.022 million. That's only up a little from August's level, but August's level was also a sky-high print.
New Home Sales Chart
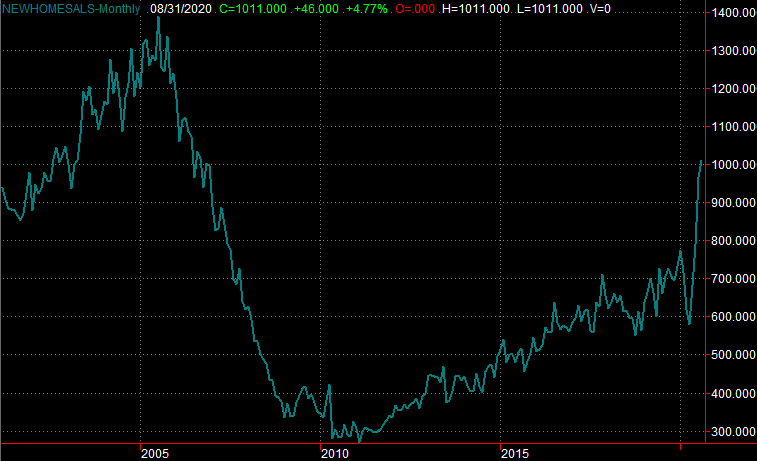
Source: Census Bureau, TradeStation
In the same vein, although a month behind, this week we'll get the latest home price data from Standard & Poor's as well as the FHFA. The S&P Case-Shiller Home Price Index should show another solid 3.8% year over year improvement for August, and economists are predicting a strong 0.8% increase for the FHFA measure between July and August. The headwind both bumped into immediately after the coronavirus pandemic started to spread in the United States seems to have been overcome.
Home Price Index Charts
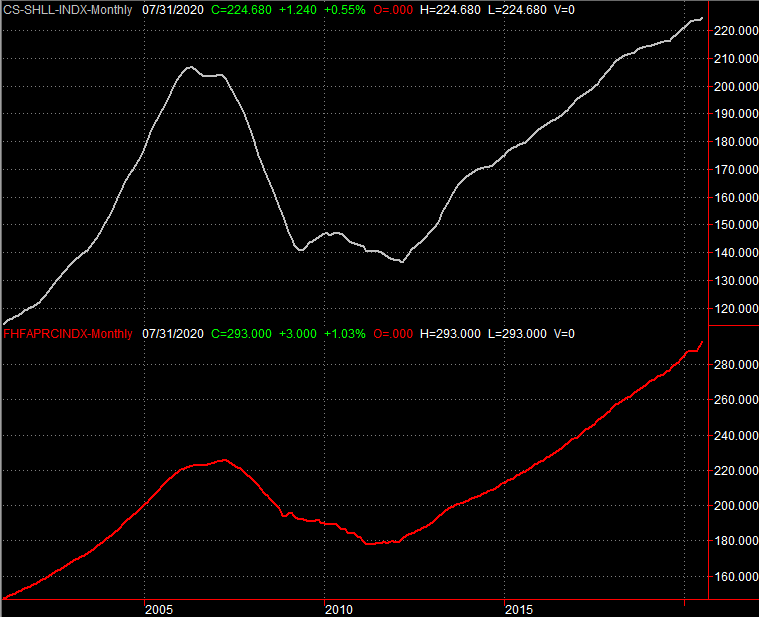
Source: Standard & Poor's, FHFA, TradeStation
Clearly the real estate sliver of the economy hasn't been crimped this year, though do bear in mind that ultra-low interest rates and a jobs market that still actually has most people working (even if at home) may be artificially stimulating some of this strength.
To this end, we're also going to get two key measures of consumer sentiment this week. The Conference Board's Consumer Confidence score for September is due on Tuesday, while the third and final report of the University of Michigan Sentiment Index is coming on Friday. Economists believe both will be up only a little from their previous levels, but those previous levels from August were the best readings we've seen since March's coronavirus-driven meltdown.
Consumer Sentiment Charts
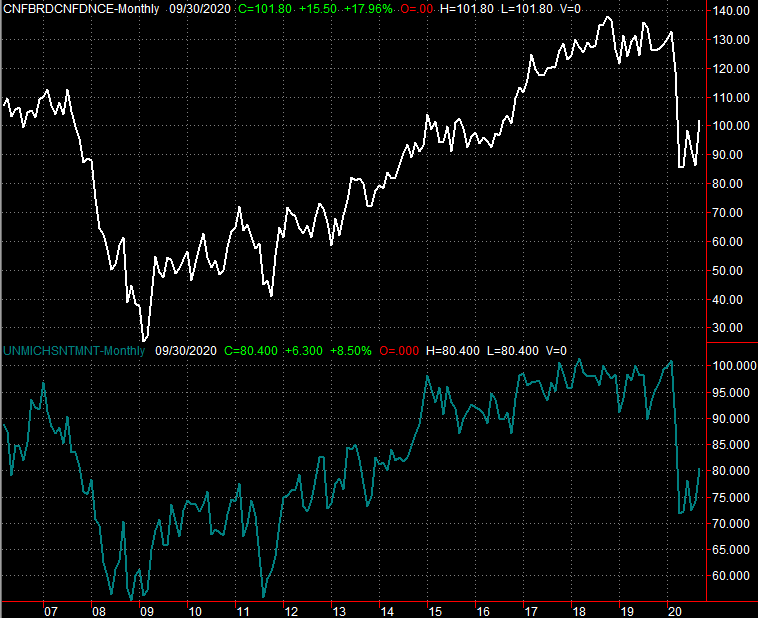
Source: Conference Board, University of Michigan, TradeStation
On Thursday we'll get the first (of three... four calculations, actually) for Q3's GDO growth. Take it with a grain of salt. Economists are looking for a 30.2% improvement after Q2's COVID-19 shutdowns. Everyone's just guessing. Even so, it's encouraging to see how quickly things are turning around. Even if that guess is just in the ballpark, it's a step in the right direction.
Stock Market Index Analysis
The indices took a loss last week, but all of it was suffered on Monday. The rest of the week, the market was buoyed by support at its key near-term moving average lines. For the S&P 500, that's the 20-day (blue) and 50-day (purple) moving average lines, the former of which crossed back above the latter on Wednesday. For now, the bulls are holding the line.
S&P 500 Daily Chart, with VIX and Volume
Source: TradeNavigator
Ditto for the NASDAQ Composite. Also notice that both the VXN and the VIC broke below their 20-day and 50-day moving average lines.
NASDAQ Composite Daily Chart, with VXN

Source: TradeNavigator
This is clearly good news for anyone who's long now. The timing makes sense too. This is when stocks have already started their usual year-end rally. The U-shaped curl that materialized over the course of last week is ideal for getting rallies going too. It's also worth noting that the NASDAQ's up and down volume is leaning in a bullish direction. It's choppy, erratic daily volume, but it's net-bullish. The same goes for the NYSE's breadth and depth.
NASDAQ Composite Daily Chart, with Up/Down Volume, and Up/Down Volume Trend
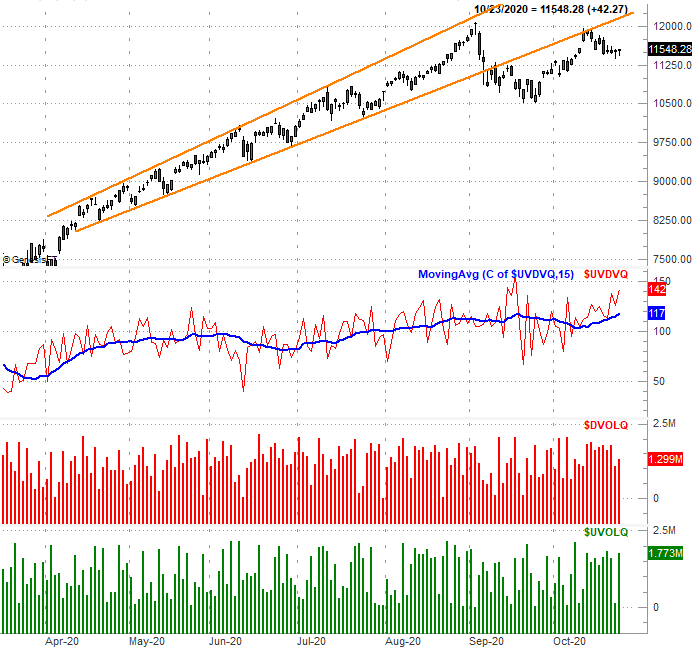
Source: TradeNavigator
Still, this isn't the way we'd really like to see the year-end rally get going. It's at a big disadvantage. That disadvantage is the depth of the gain since the March low. The NASDAQ Composite is up 74% from the March bottom, and as such, is overbought. Part of that froth comes in the form of the index being 18% above its 200-day moving average line (green), which is a little more than its historical extreme divergence. You'll also see the NASDAQ Composite's RSI indicator is just coming out of an overbought condition that wasn't quite as overbought as it was in August. In short, it's tougher to hang on to recent gains and add new ones.
NASDAQ Composite Weekly Chart, with VXN, RSI, and MACD

Source: TradeNavigator
Although stocks ended last week on a high note, this isn't enough of a reason to plow in. Overbought or not, before an election and against a backdrop of COVID, anything could still happen from here. That includes gains, although the slower, the better. In fact, a slow walk higher could last through the end of the year (if it paces itself well). At the other end of the spectrum, any selloff worth trading would at the very least have to start with a break below the 20-day and 50-day moving averages. And even then, there's a great deal of technical support right below those levels. We'd really like to see the VXN and VIX break above their straight-line ceilings before sweating too much. That breakout would also have to coincide with a break below the 200-day moving average lines. That leaves room for meandering that - ultimately - means very little. For now though, the bulls do have the edge.


