
Weekly Market Outlook – Still Defying The Odds
It was touch and go for the better part of last week, but when push came to shove as the weekend approached, it was the bulls doing most of the shoving. Thanks to Friday's 0.64% gain, the S&P 500 ended the week on a high note that was underscored by the NASDAQ Composite's cross above its 200-day moving average line.
The market is still vulnerable, but it's considerably less vulnerable now than it was as of Thursday.
We'll discuss why below, as always. But, let's first run down last week's economic news and preview this week's announcements. The key data remains mixed, and a couple of this week's reports have the potential to rock the market in a big way.
Economic Data Analysis
Not a lot of announcements this past week, which was shortened by the holiday. We did get a couple of noteworthy announcements though, including what ended up being a fairly predictable release of the minutes from the last FOMC meeting. The short version of the story: The Fed knows it doesn't have to be in a hyper-aggressive hurry with its rate hikes.
There were two quantifiable data nuggets to dissect though. One of them was January's existing home sales data, and the other was the prior week's report of stockpiled oil.
Existing home sales fell, from a pace of 5.0 million to only 4.94 million. But, it was a contraction at a point in time when the market really needs to see forward progress in home sales.
New, Existing Home Sales and Inventory Charts
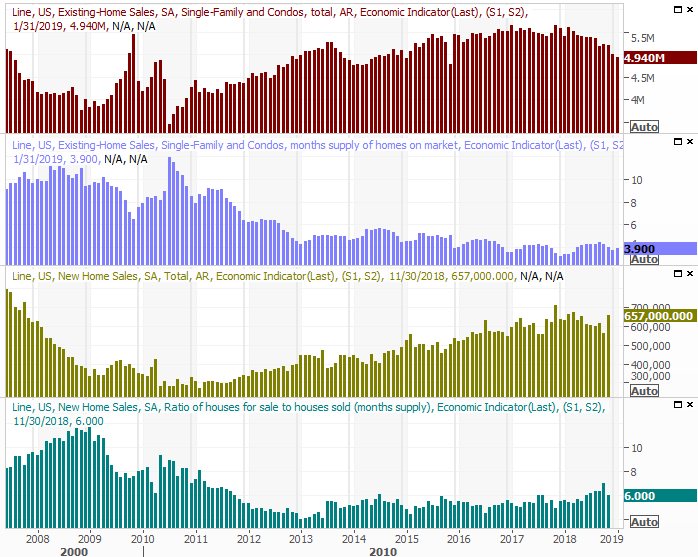
Source: Thomson Reuters
We still don't have the new home sales figures that were not released on schedule due to the government shutdown, and no clear picture as to when we'll get that data. Most likely, it'll be released with the next regularly scheduled update the week after next. But, given the data we can see, it's unlikely the new-home sales market is much different than the existing home sales market.
Crude Oil, Natural Gas Inventory Charts
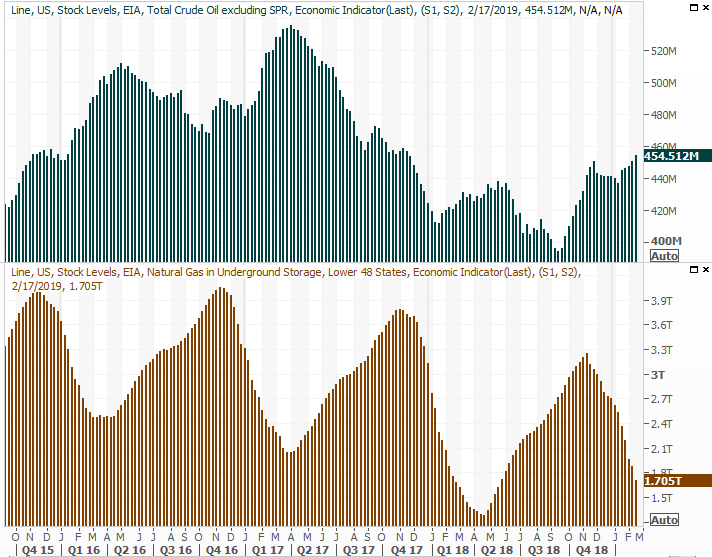
Source: Thomson Reuters
As for crude stockpiles, they continue to edge higher. They may even be accelerating, mostly thanks to excessive production by the U.S. It hasn't proven too troubling for oil prices yet, but the undertow is moving in that direction.
Also, though not illustrated with a chart, durable goods orders for December rolled in measurably better
Everything else is on the grid.
Economic Calendar
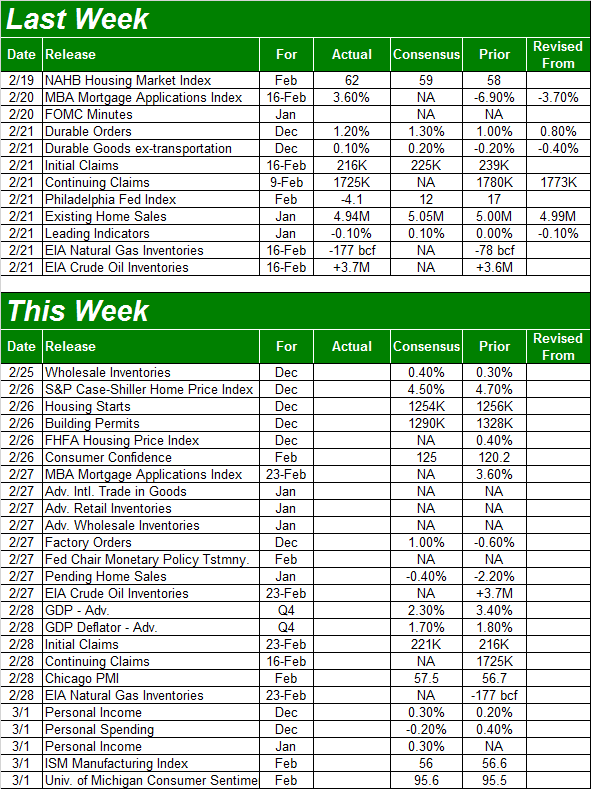
Source: Briefing.com
This week is going to be much busier, particularly on the real estate front.
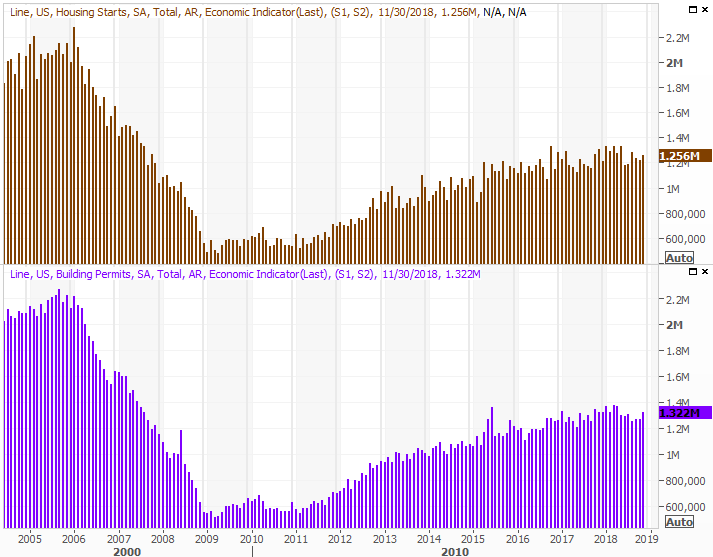
The party starts on Tuesday with a double-dose of data. One of those data sets is December's housing starts and building permits, which are expected to slide a little lower. Also know, though we might also hear January's data. Whatever the case, the bigger trend here has been one that's shifting from growth to stagnation.
Housing Starts and Building Permits Charts
Source: Thomson Reuters
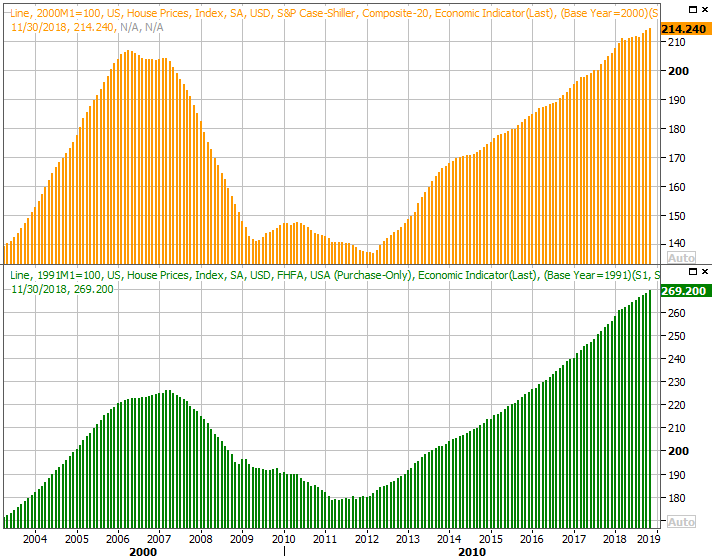
Also on Tuesday we'll get the S&P Case-Shiller Home Price Index, followed by the FHFA Housing Price Index. Both should continue to rise, although both are also seeing a slowdown. Still, even slow progress is better than the alternative.
Home Price Index Charts
Source: Thomson Reuters
Bear in mind the home price numbers will be for December, not January.
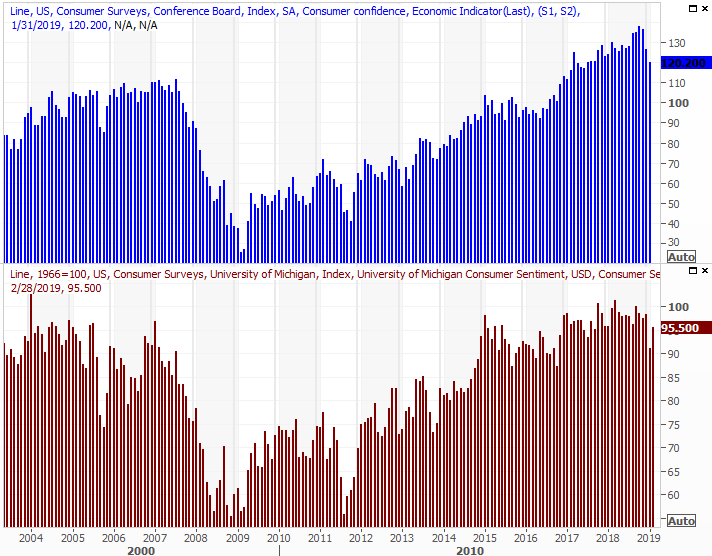
On Wednesday we'll get February's consumer confidence figure from the Conference Board, followed by the third and final Michigan Sentiment Index reading on Friday. Both are projected to improve, but the bar is set low as the government shutdown last month looked and felt terrifying at the time.
Consumer Sentiment Charts
Source: Thomson Reuters
Regardless, even if sentiment only stabilizes at current levels, it's strong.
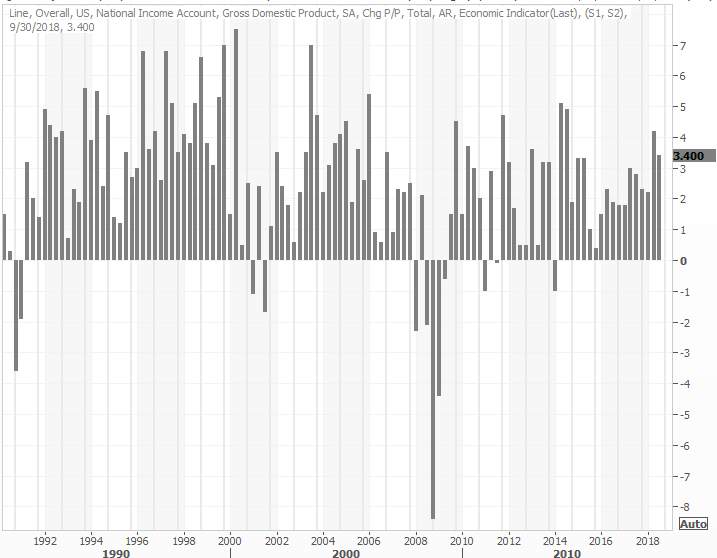
The coming week's big Kahuna, of course, is the first look at Q4's GDP growth rate. Economists are calling for 2.3% growth, falling from Q3 3.4% mostly thanks to the impact of new tariffs and fears about the impact of a government shutdown even that it only got started near the end of the quarter. That's not a great reading, and though it's subject to change, updates are rarely dramatic.
GDP Growth Rate Charts
Source: Thomson Reuters
Nevertheless, 2.3% isn't bad, particularly if it starts to look like GDP growth is positioned to improve again in the quarter currently underway.
Stock Market Index Analysis
Success! What was quickly becoming problematic last week ended up turning into another respectable victory, thanks to Friday's win. Whatever it takes. Nevertheless, there are a couple of red flags worth noting.
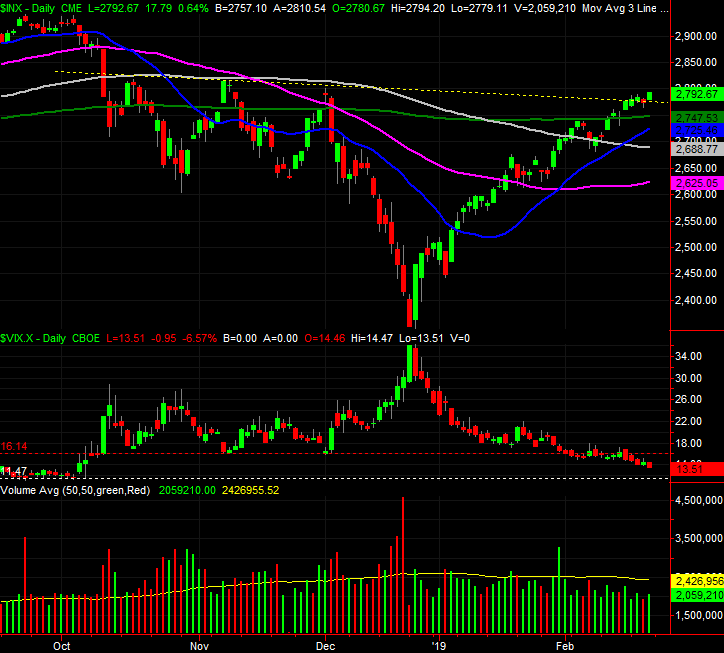
But, first things first. As the daily chart of the S&P 500 immediately below makes clear, the prior week's move above the pivotal 200-day moving average line has since been widened. Last week's collective strength also pushed the S&P 500 over a minor technical ceiling (yellow, dashed) that had tagged all the minor peaks since the big rout that started in October.
S&P 500 Daily Chart, with Volume
Source: TradeStation
The NASDAQ Composite's daily chart looks more or less the same, but with one exception - the composite didn't hurdle its 200-day moving average line until Friday. Nevertheless, the deed is done.
NASDAQ Composite Daily Chart, with Volume
Source: TradeStation
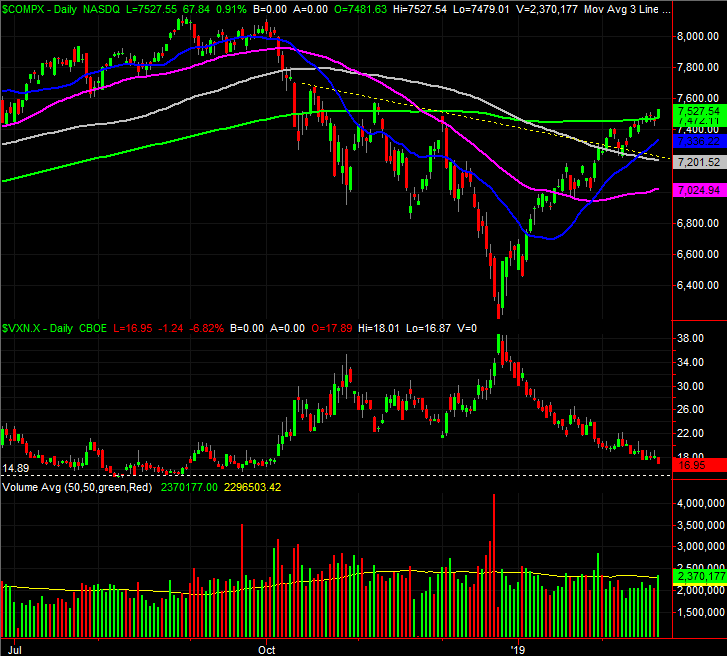
There are some concerns, not the least of which is the fact that both the VIX and the VXN are nearing well-established technical floors that have coincided with significant headwinds, if not outright pullbacks. Also, at least for the S&P 500, the buying volume continues to deteriorate on the way up. (The NASDAQ is still in question in that regard. Its volume surged with Friday's gain.)
Those aren't the red flags worth a closer look though.
We rarely look at indicators other than moving average lines and volume-based tools, mainly because there's little need to. This week though, we want to apply MACD lines and the RSI indicator to the daily charts of the S&P 500 and the NASDAQ, as they're showing us something that doesn't readily appear on our usual images.
In short, the MACD (moving average convergence/divergence) indicator is pointing out a slowdown in the market's bullish momentum. Meanwhile, the RSI (relative strength index) has just touched its "overbought" threshold at 70 for the S&P 500, and is about to for the NASDAQ.
S&P 500 Daily Chart, with MACD and RSI
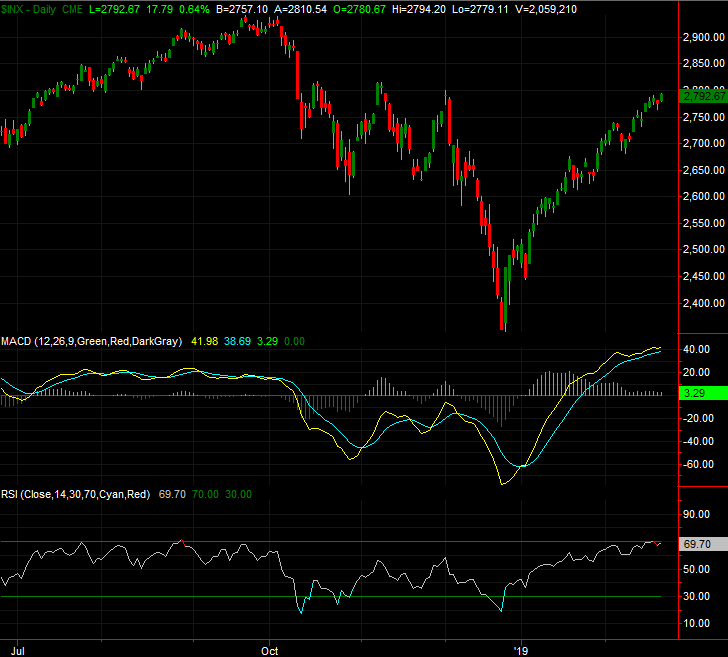
Source: TradeStation
NASDAQ Composite Daily Chart, with MACD and RSI
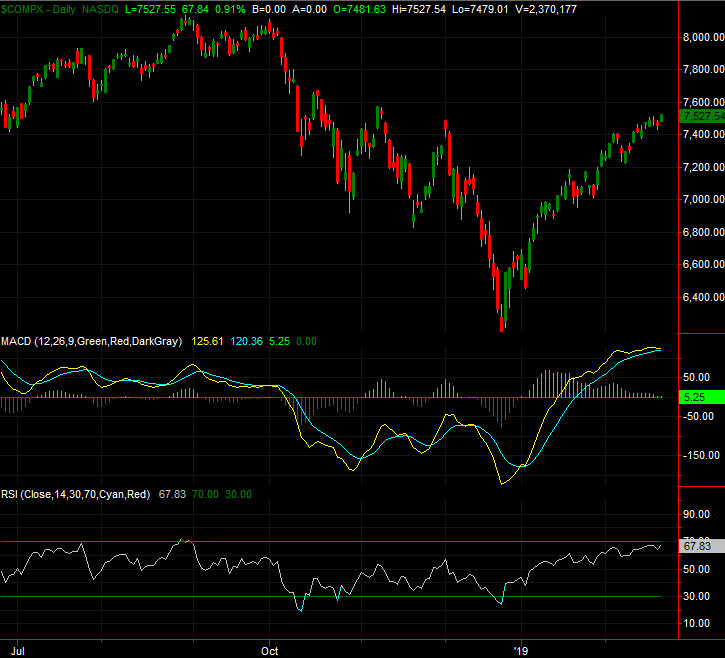
Source: TradeStation
Past performance is no guarantee of future results. But, from an odds-making perspective, clearly this is cause for concern. The RSI indicator tends not to stay at these high levels very long. More often than not, it's unwound with a pullback.
Don't misread the message. There are pullbacks, and then there are beat-downs. A small pullback could easily do the job. In fact, a small pullback here would actually be of great benefit, cooling off an overheated market before it races into a situation where there's little choice but to start taking profits in such a way that the selling becomes self-sustaining. As long as one of the familiar moving averages serves as a support during any stumble, the bigger trend is still a bullish one. And, as of Friday, any of the key four moving average lines could step up and act as a floor.
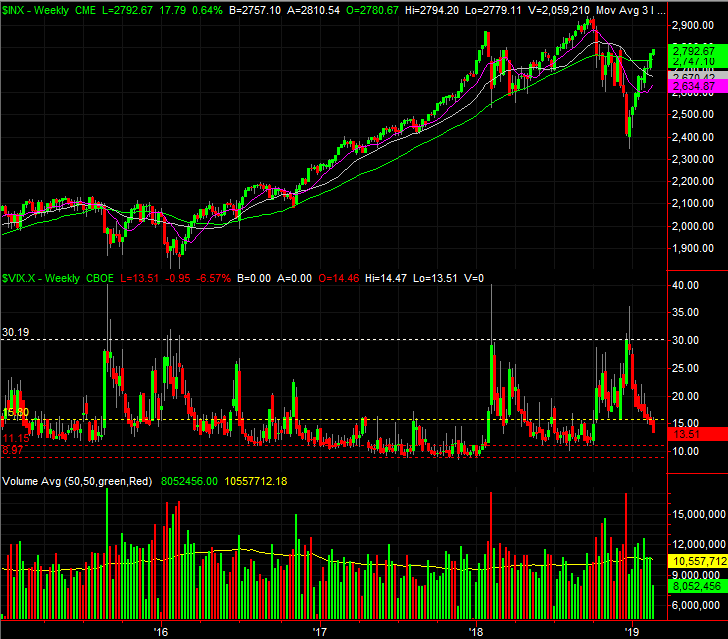
To that end, zooming out to a weekly chart puts things in perspective. It's with this weekly view of the S&P 500 we can see just how wildly bearish the fourth quarter of last year was, and how strong - perhaps a little too strong - the rally has been in the meantime. A slower-paced uptrend would actually be more sustainable, but it might take a pretty good punch to bring the bigger-picture rally back to a more palatable pace.
S&P 500 Weekly Chart, with Volume
Source: TradeStation
Of course, the market could once again defy the odds altogether and insist on responding to every bullish interpretation of every headline, and keep in chugging. This remains an environment where it's better to respond to what the market is doing rather than what we think it should be doing, even if what the market is doing is a setup for some extreme - and probably painful -- volatility.


