
Weekly Market Outlook – Calendar-Driven Bullishness Is Still Bullishness
The holiday shortened week ended up being a good one. Pushing through the stagnation that took shape from the week before, the S&P 500 rallied 2.3% last week to end Friday at a record high close (after reaching a record intraday high on the same day). The Nasdaq did the same. Suspiciously though, while the Nasdaq Composite may have logged its best-ever close on Friday, but it's not decisively pushed its way past its technical peal established back in early September and confirmed in early November.
It's not a terribly big surprise. This is a bullish time of year, and Thanksgiving week is generally bullish - albeit modestly - anyway. Though it stalled the week before, stocks have been in a rather bullish mode since early November.
Still, we're seeing a handful of red flags that this rally's getting tired.
We'll take a detailed look at those red flags below, as always. First though, let's review the economic underpinnings of what's ultimately going to make or break the market. This week we'll get a huge one...Friday's jobs report for November.
Economic Data Analysis
As we would have guessed given the prior week's strong real estate data, home prices are firm as well. In fact, home prices are arguably the strongest piece of the real estate puzzle. Economists were calling for another round of solid increases in values, and we got even more price appreciation than was modeled for September.
Home Price Index Charts
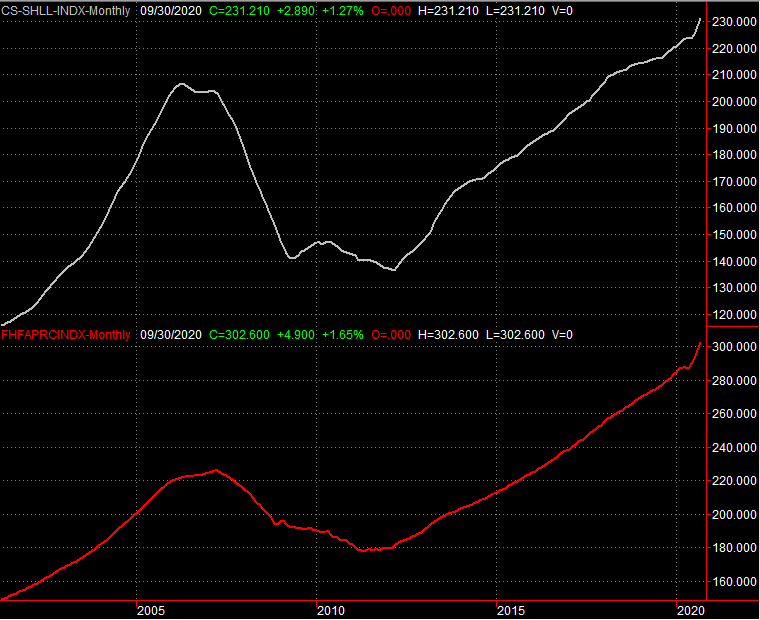
Source: Standard & Poor's, FHFA, TradeStation
In this vein, new home sales remained robust in October, coming in at an annual pace of just below one million, versus a figure of just above one million for September. Both are well above average, and well above trend. The stimulative intent of low interest rates is working, as least within housing's sliver of the economy. [We don't have enough existing home sales data to create a meaningful visual plot, though it's historically mirrored the new home sales trend.]
New Home Sales Charts
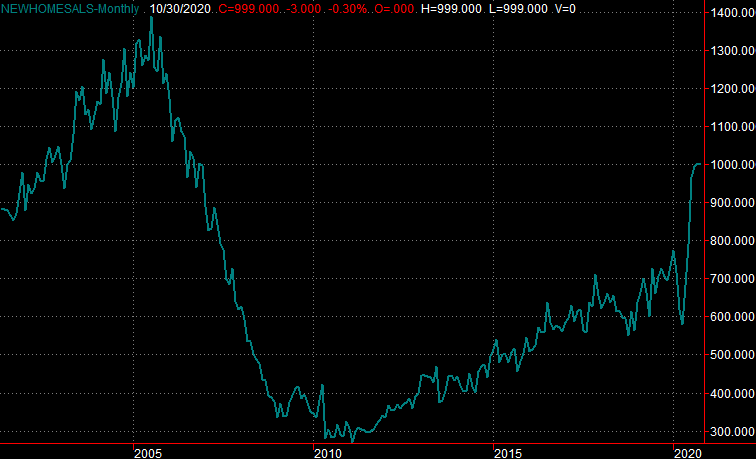
Source: National Board of Realtors, Census Bureau, TradeStation
As for consumer confidence, although both measures fell in November from October's levels, given the resurgence of the COVID-19 pandemic, things could have been worse. Conversely, as much as the market has climbed since the coronavirus took hold, it's strange that consumer confidence remains miles away from its pre-pandemic peak.
Consumer Sentiment Charts
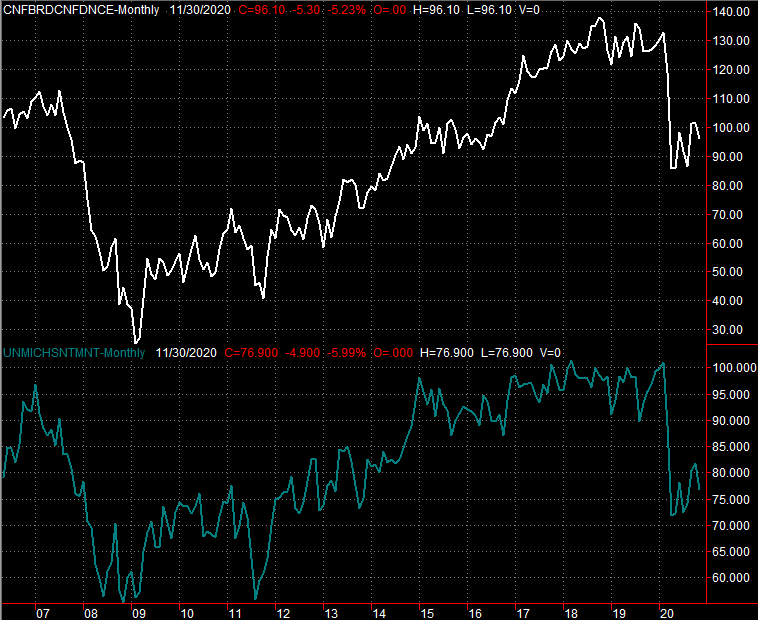
Source: University of Michigan, Conference Board, TradeStation
That being said, be wary of another monthly drop for one or both of these sentiment scores. The market may shrug off one lull, but two back-to-back lulls could more easily indicate consumers have or soon will tighten their purse strings.
Everything else is on the grid.
Economic Report Calendar

Source: Briefing.com
This week is going to be a busy one, as we transition from November into December. The big number everyone's going to be eyeing is of course Friday's jobs report. Economists are expecting the creation (net) of 650,000 new payrolls, but that won't likely be enough to pull the unemployment lower than its current level of 6.9%. Just bear in mind we've been pleasantly surprised by these numbers in recent months.
Unemployment Rate and Payroll Growth Charts
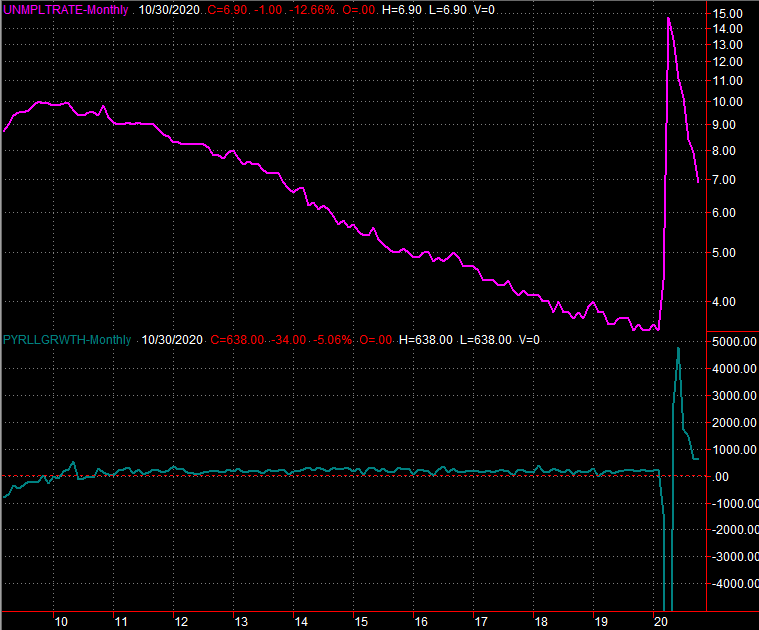
Source: Department of Labor, TradeStation
We're also going to be getting both ISM figures this week... manufacturing, and services. Each is expected to have fallen a bit for November, yet each remains well above the critical 50 level (under which suggests a contraction is at hand).
ISM Services and Manufacturing Index Charts
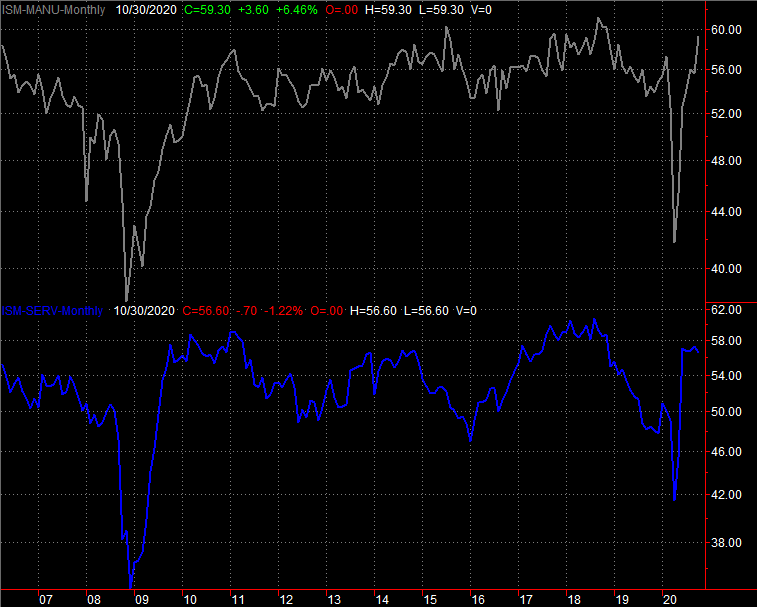
Source: Institute of Supply Management, TradeStation
Finally, although we're not showing a chart of it, keep your eyes and ears open for November's auto sales data beginning on Tuesday. It trickles in, and not every company still reports their monthly numbers. Enough do, however, that we can get a feel for how this part of the nation's economy is faring.
Stock Market Index Analysis
As is usually the case, stocks made modest progress during the Thanksgiving-shortened week. Although just barely, most of the indices tiptoed into record-high territory. It's not the ideal advance, however.
The daily chart of the S&P 500 fleshes out some of the reasons why this is a worry. One of them is, there's a gap left behind from Tuesday's bullish open. There's also the VIX, or Volatility Index. It reached the 20 area late last week, which is something of an absolute floor... usually reached when stocks are reaching a near-term peak. The S&P 500 itself is also now a little over 15% above the 200-day moving average line (green) at 3152. That's a pretty unusual extreme as well.
S&P 500 Daily Chart, with VIX and Volume
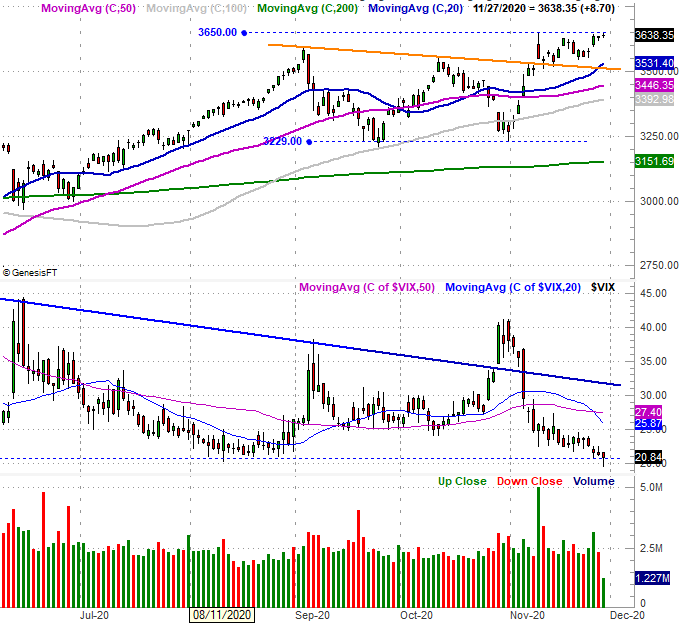
Source: TradeNavigator
The weekly chart of the S&P 500 puts all of these realities in more perspective. It also reminds us just how far and how fast we've come since March's low. Granted, the steep February/March selloff set up a huge recovery. Nevertheless, the runup represents a gain of 66% in just nine months. That's a tough act to follow regardless of the circumstances.
S&P 500 Weekly Chart, with VIX and Volume
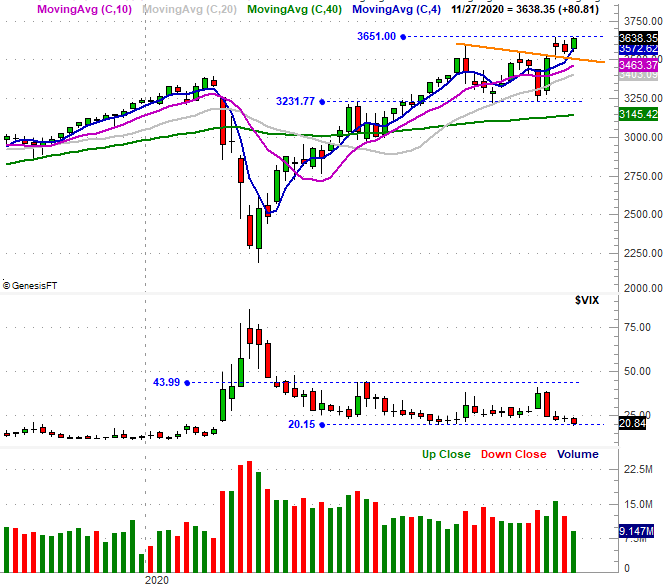
Source: TradeNavigator
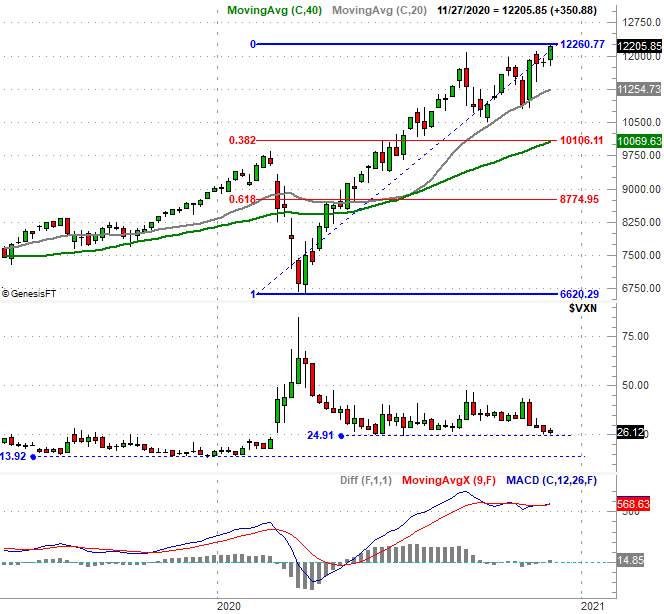
Same deal for the Nasdaq Composite, though to an even more extreme degree. The composite is up 84% from March's bottom, blowing past its February peak in June. Although overextended and ripe for a pullback, the Nasdaq's Volatility Index -- the VXN -- isn't yet to its more absolute support. [It is at an intermediate floor though.] Meanwhile, the MACD indicator just dished out a brand new buy signal, by virtue of last week's bullish crossover.
Nasdaq Composite Weekly Chart, with VXN, and MACD
Source: TradeNavigator
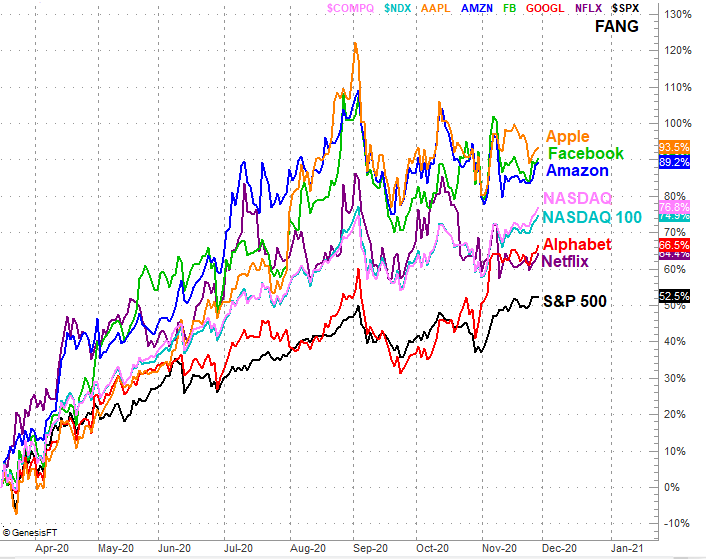
Be wary though. This is a strangely unbalanced advance.
The chart below illustrates how. This advance has been decisively led by only a few stocks, including (most of) the all-important FANG stocks that are the biggest of the big Nasdaq names.
FANG Stock Performance Comparison vs. Major Indices
Source: TradeNavigator
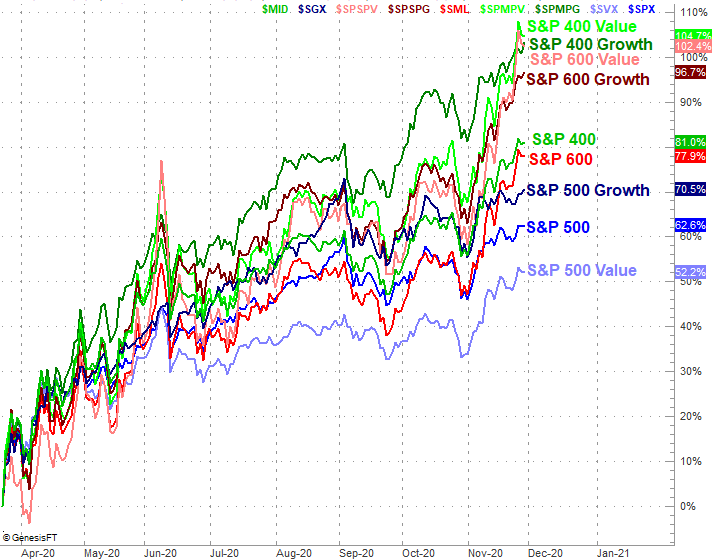
Except, there's a curious glimmer of encouragement from other areas that don't make a big, noticeable, overall impact on "the broad market." Mid caps and small caps are outpacing the S&P 500 large caps since March's low... by a country mile. It doesn't matter if you're talking about growth or value either. This indirectly points to an aggressive, bullish mindset coming out of the March lull. (The S&P 600's and S&P 400's growth and value indices are both outpacing the S&P 400 and S&P 600 as they are the "pure" indices that don't include any blended-style stocks.)
Style, Market Cap Performance Comparison
Source: TradeNavigator
Simply put, this is a strange scenario... though appropriately so, given the strangeness of the entire year. We're more inclined to expect a pullback from here given the shape and timbre of things. But, between the calendar and the clear momentum now in place, that's not a bet anyone can afford to blindly make here. The S&P 500 would have to fall all the way below its 100-day moving average line at 3393 before the advance is disrupted enough to worry. The VIX would also have to make a clear reversal of its downtrend to force the bulls into a true sweat. That's not happened yet either.


