
Watch For Reversal In The Dow Jones Transports (DJT) As It's At Critical Resistance
Dow Jones Transportation Average (DJT):
- Short-Term/Daily: Stodgy Uptrend since May 2017. New high made last Thursday, November 30. Possible major reversal starting.
- Intermediate-term/Weekly: Uptrend since January 2016. Current new high hit circular resistance. Watch for possible reversal.
- Long-Term/Monthly: Uptrend since March 2009. Current market also appears to be topping at major geometric resistance.
SHORT-TERM/DAILY:
Last Thursday, November 30, the DJT broke out to a new record high of 10,347.93. The following day the market quickly fell to support of 10,011.95, closing down for the day at 10,186.63. This activity formed a 2-day short-term reversal candle pattern known as a ‘bearish harami’, and it is especially powerful after an extended or strong bull run such as seen over the preceding two weeks.
(A ‘harami’ candlestick pattern is present when the current period’s open and close occurs inside the open and close of the preceding period. With a ‘bearish harami’ the pattern shows up after the market advances, with an up-close period followed by a down-close period, with the inside open and close.)
However, one candle reversal pattern does not a trade make. The following chart presents this bearish harami at the top of a geometric channel that identifies the rather stodgy uptrend quite effectively (points A-E):
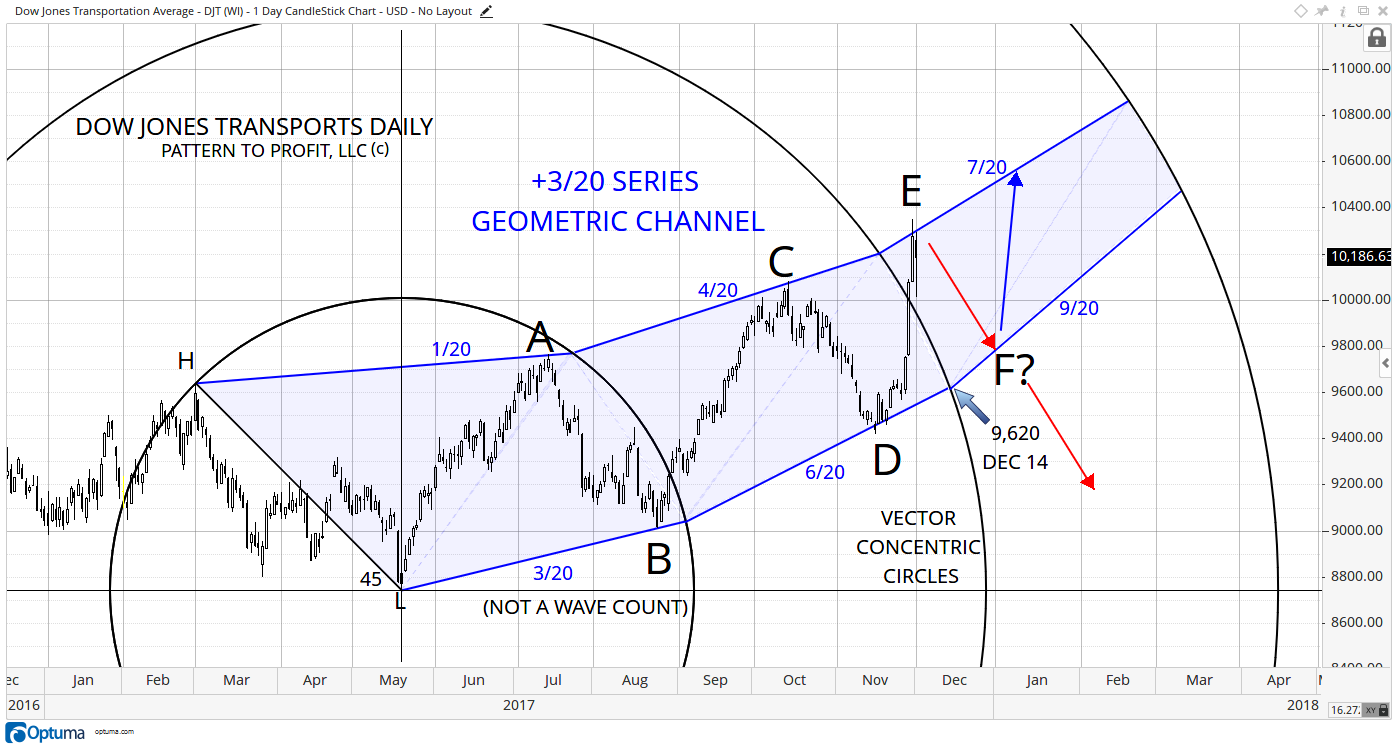
By aligning the chart’s vertical scale such that the initial downtrend (black, marked H-L) is seen at the crucial 45o (the perfect division of price and time), the subsequent price action can be revealed as perfectly conforming to the shown geometric channel of angles based on 5ths and increasing by +3/20.
Based on this observation, the following points can be derived:
- The current top is poised perfectly to drop back down to support from the lower channel angle of 9/20 (approx. F?). which starts at the circle intersection on December 14 at 9,620.
- In case the market collapses immediately, it may reach the 6/20 angle of this lower channel line prior to that circle intersection.
- If current resistance from the top channel angle of 7/20 is taken out this week, then a strong bull market is surely underway.
Assessing the potential strength or weakness of the current market’s break into new highs is critical in determining a course of action. Yet to do this we need to go no further than to simply connect the channel intersections between the angles and the concentric circles (blue dashed lines) and consider their crossing points (points A-C):
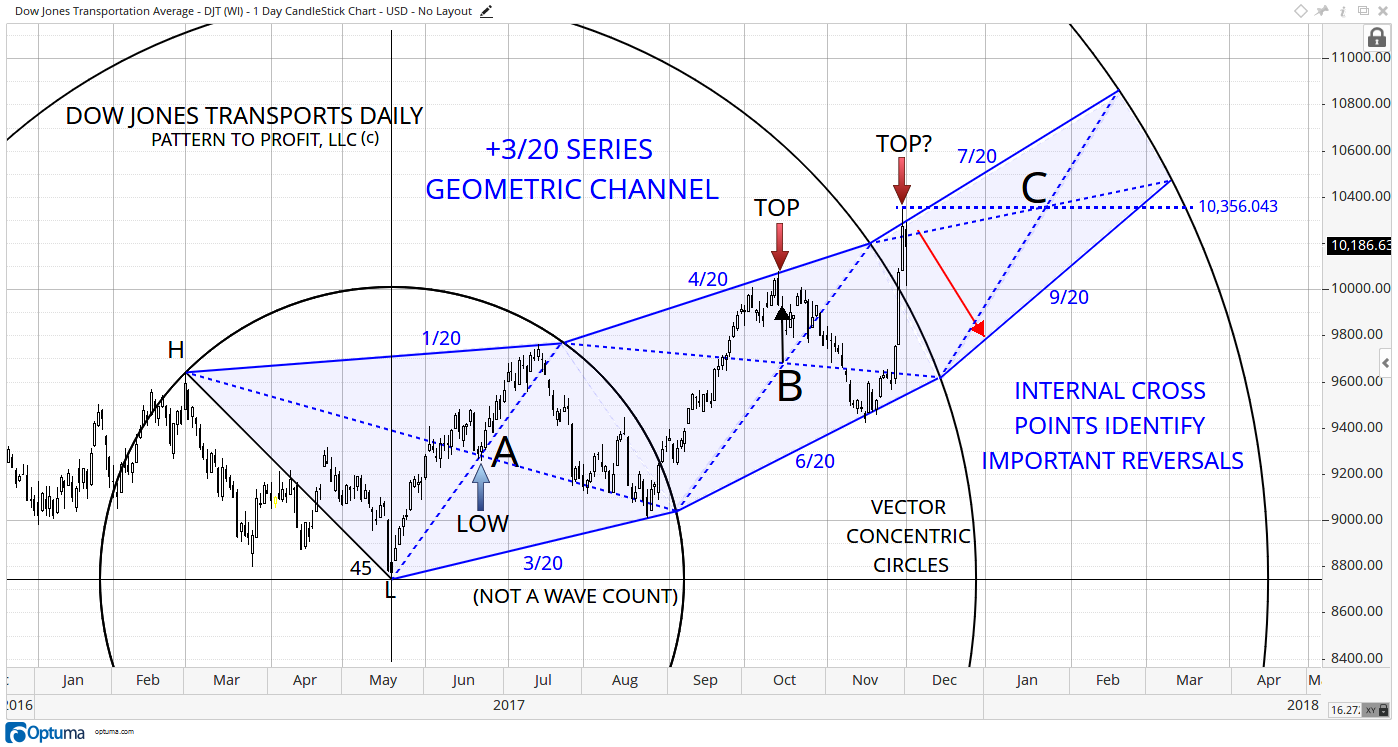
The all-time high of the current market at 10,347.93 seems rather vulnerable to the resistance offered by the price of point C at 10,356.043, just a meager 8 points above, especially considering the preceding history of the preceding high directly above B, and the interim low at A. This analysis is clearly in favor of the drop to lower channel support as indicated in the previous chart. However, it also strengthens the impact of a breach of resistance, as an even stronger barrier to the upside would have to be taken out.
Although this daily analysis shows the current market at an important crossroads as related to the vector circle high of 9,639.33 on March 1, 2017, what is revealed by comparing it to the preceding major high of 9,310.22 on November 28, 2014?
INTERMEDIATE-TERM/WEEKLY:
This weekly geometry using a 60/30 triangle (green) shows last week’s all-time high of 10,347.93 missing circular resistance of 10,354.58 by only 6.65 points:
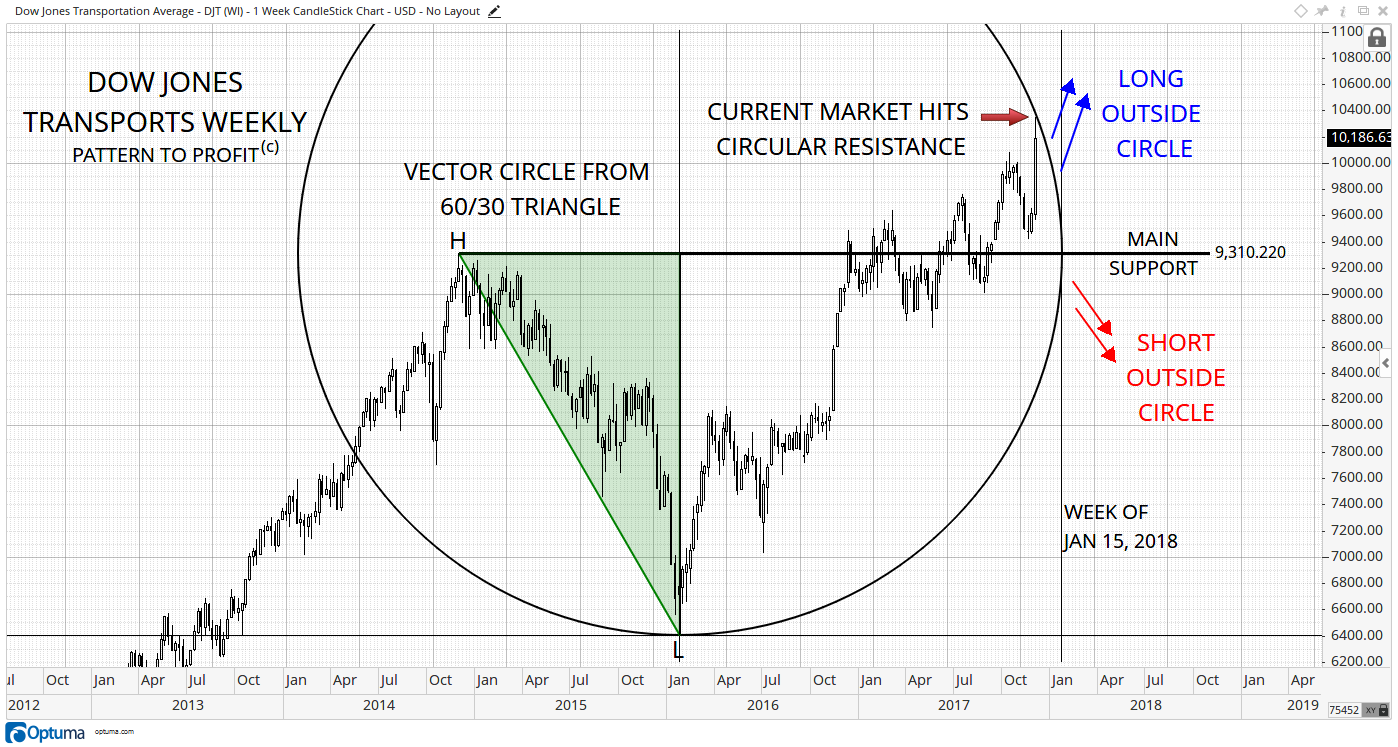
The implication from this circular geometry is that the current high is exactly related to the large preceding downtrend’s two major reversals (marked H-L). (The downtrend vector (line connecting them) is set to 60o. The green triangle shows the circle center as a square point of those two reversals.
Any new high would need to be outside of this circle. If the market stays inside it then the shorter-term trend is either sideways or down. The circle’s maximum time value of the week of January 15, 2018 (2nd vertical line) provides an expiration date for that possibility, at least the first possible leg of a larger move downward.
Upon a breakout of circular resistance, then new highs can be achieved, although certainly not guaranteed, as the market can continue to drop outside of the circle, especially below the main support of the vector high of 9,310.22.
Since both these daily and weekly analyses have bearish implications, perhaps a monthly perspective from the major downtrend is called for.
LONG-TERM/MONTHLY:
The 2nd major preceding downtrend occurred from May 1999 to February 2003 (marked H-L). When set to 45o with the blue channels of 2/5 (or 36o) angles added, the entire market comes into perspective:
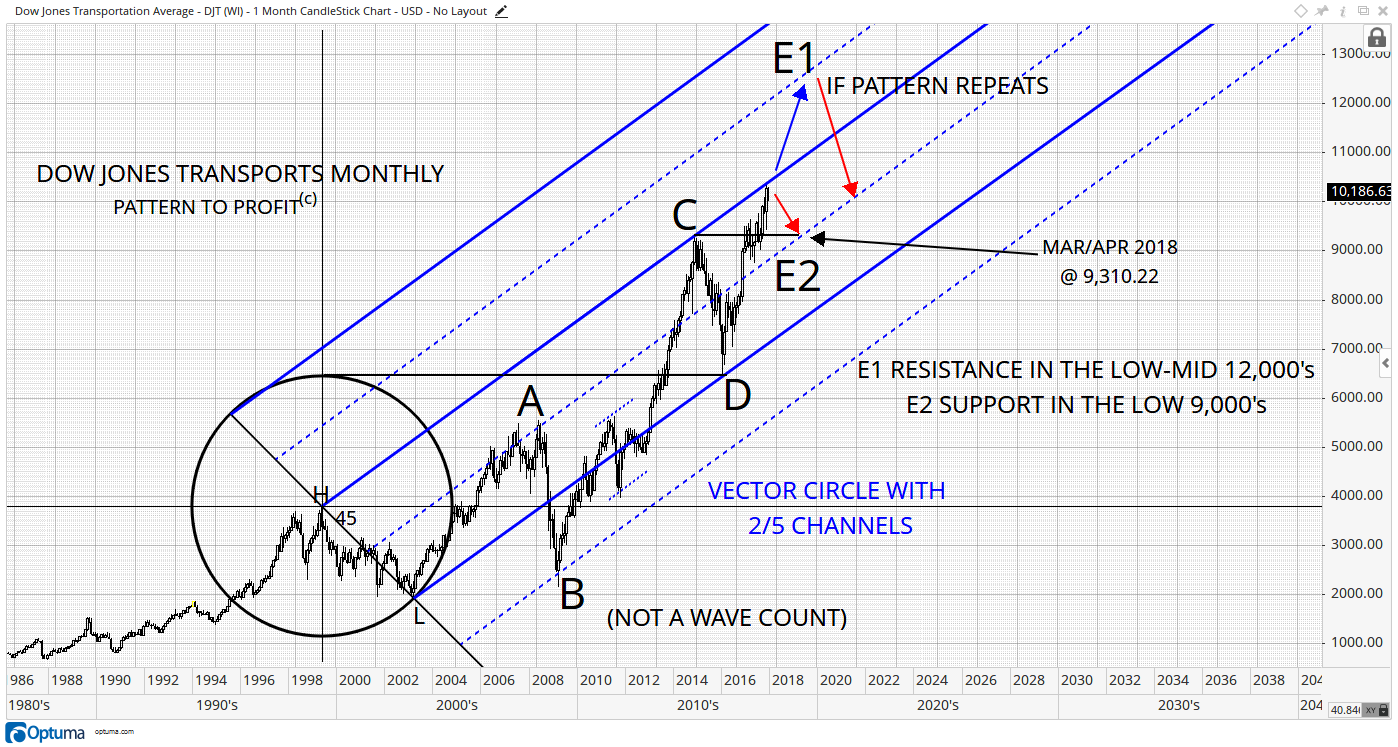
Once again, the current market top is right on critical resistance (three for three), this time being associated with the high at C (which was the vector high in the weekly analysis).
The preceding uptrend from point B to C traveled 1.5 channels (dashed blue angles are half-channel lines). If this activity repeats, then the above half-channel line offers resistance (E1).
However, a market can firstly and even immediately move back down to support at E2. A quick drop could result in reaching the 9,000 area by June 2018.
If the market drops at a steady pace, then support from the high at C’s price of 9,310.22 on March/April 2018 makes a reasonable target, as the main support level in the weekly analysis meets E2’s support angle.
Disclaimer: Pattern to Profit, LLC, any affiliates or employees or third party data provider, shall not have any liability for any loss sustained by anyone who has relied on the information contained ...
more

