
VIX Run Above 20 Tops 200 Days
With today’s close, the VIX has now stuck above 20 for 207 trading days and counting. That marks the fourth-longest streak since the inception of the volatility index and is approaching the late-1990s and early-2000s record runs. The index was above 20 for 239 trading days through the end of June 1999, and 236 trading days through May 8th, 2003. Of course, from 2008 to December 21st of 2009, the VIX was over 20 for 331 trading days (more than a year).

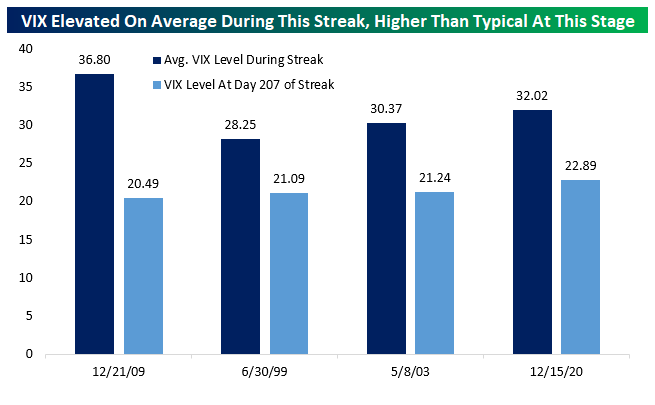
Surprisingly, the current VIX streak has had an average reading higher than the two longer streaks in 1999 and 2003. The average 32.0 reading over its course so far is second only to the streak recorded over the global financial crisis. It’s also interesting to note that at this stage in the streak (207 trading days), the current run has a higher reading than the three streaks which actually lasted longer.
Disclaimer: To begin receiving both our technical and fundamental analysis of the natural gas market on a daily basis, and view our various models breaking down weather by natural gas demand ...
more

