
(Click on image to enlarge)
Uber’s Decade of Growth in Users and Rides
Over the past decade, UBER has quickly become a fixture of urban mobility, seeing rapid growth in both its user base and number of trips taken annually.
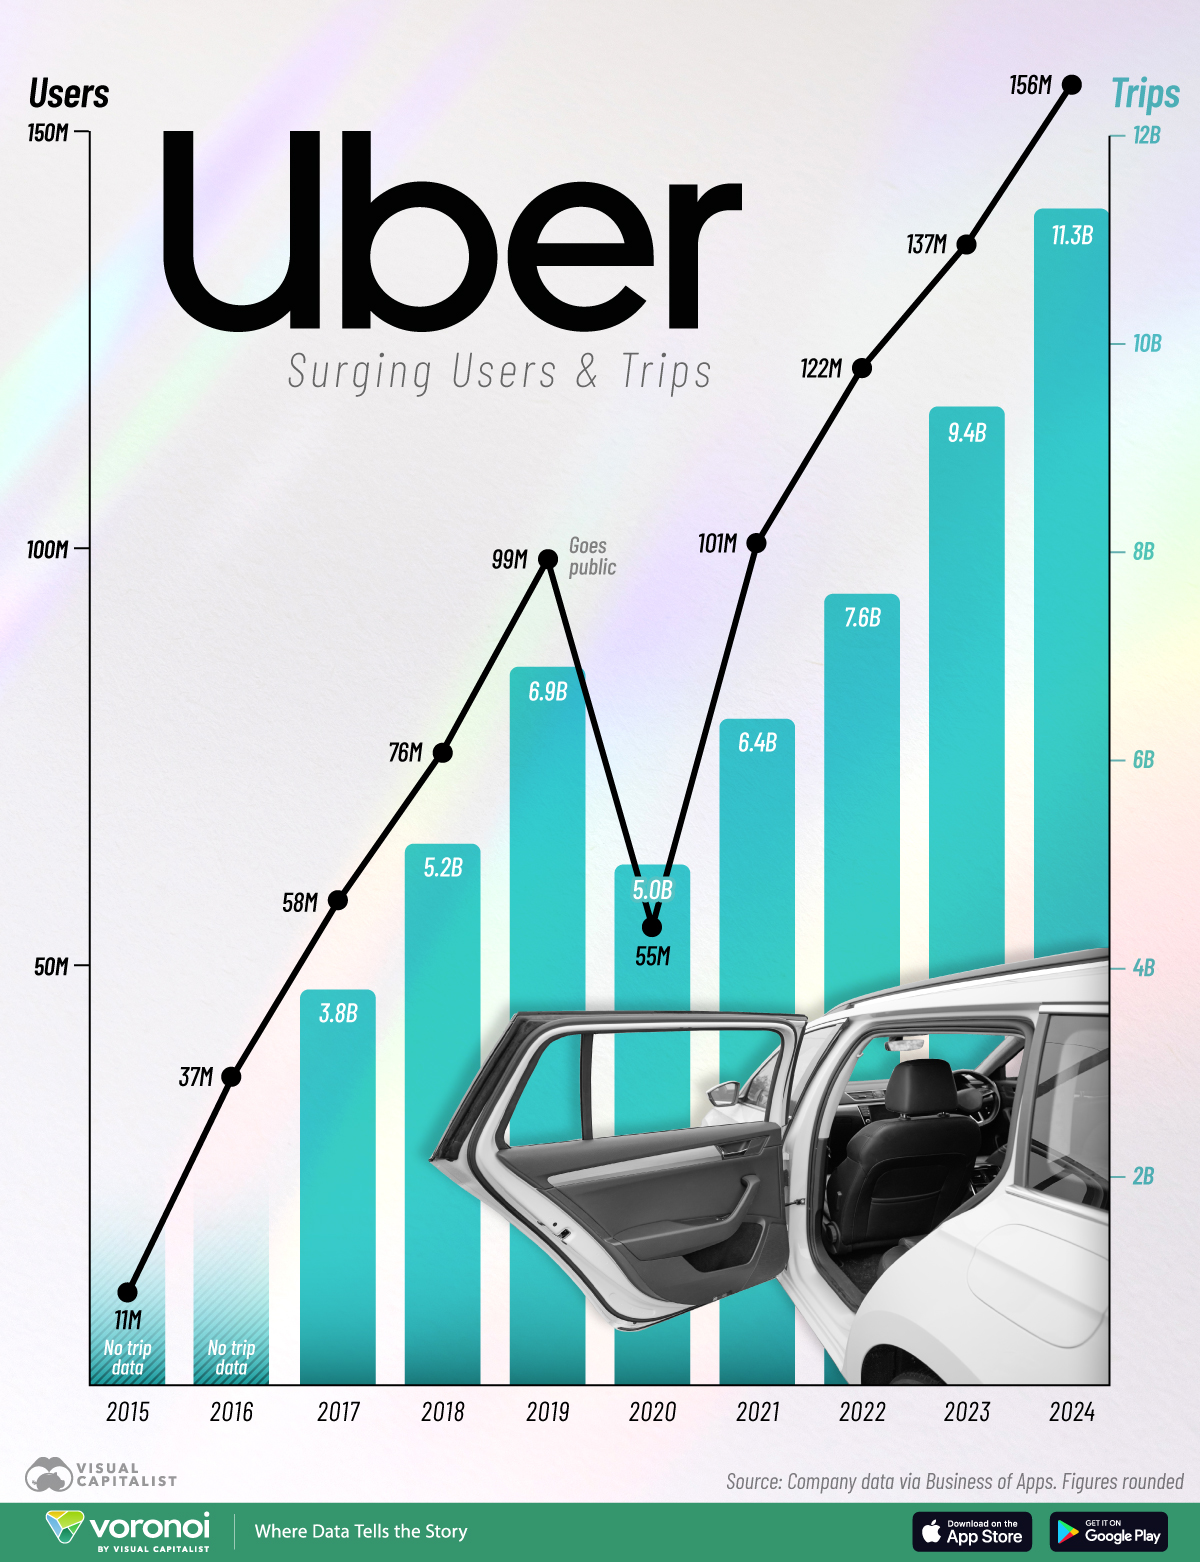
This chart visualizes Uber’s users and trips figures from 2015 to 2024. Users are shown with the black line and labels with the y-axis on the left side while trips are shown with the light blue bars with the y-axis on the right side.
Data for trips is unavailable for 2015 and 2016. Company data comes from Business of Apps.
Uber Has Been Growing Significantly
Below, we show the number of Uber users in millions and Uber trips in billions from 2015 to 2024.
| Year | Uber users (millions) | Uber trips (billions) |
|---|---|---|
| 2015 | 11 | n/a |
| 2016 | 37 | n/a |
| 2017 | 58 | 3.8 |
| 2018 | 76 | 5.2 |
| 2019 | 99 | 6.9 |
| 2020 | 55 | 5.0 |
| 2021 | 101 | 6.4 |
| 2022 | 122 | 7.6 |
| 2023 | 137 | 9.4 |
| 2024 | 156 | 11.3 |
Uber’s global user base climbed to 156 million in 2024, an increase of 14 times since 2015 and roughly 58% higher than its IPO year in 2019.
Meanwhile, annual rides hit 11.3 billion in 2024, equivalent to an average of 72 rides per use throughout the year.
After a sharp dip in 2020 due to the COVID-19 pandemic, when users dropped to 55 million and trips to 5 billions, Uber rebounded swiftly.
By 2022, both metrics had recovered to surpass pre-pandemic levels, continuing their upward trajectory into 2024.
Uber’s global presence and commitment to innovation are stronger than ever, with the company ranking among the leaders in R&D spending growth.
As part of its push into autonomous mobility it recently launched ride-hailing services with Waymo’s self-driving vehicles in Atlanta and Austin directly through the Uber app.
More By This Author:
Chart: The Plummeting Cost Of Renewable Energy
How Much Revenue Do Tech Giants Earn Per Employee?
G7 Vs. The World: GDP, Population, And Military Strength


Comments
Log in or sign up to join the conversation.