
Veracyte - Chart Of The Day
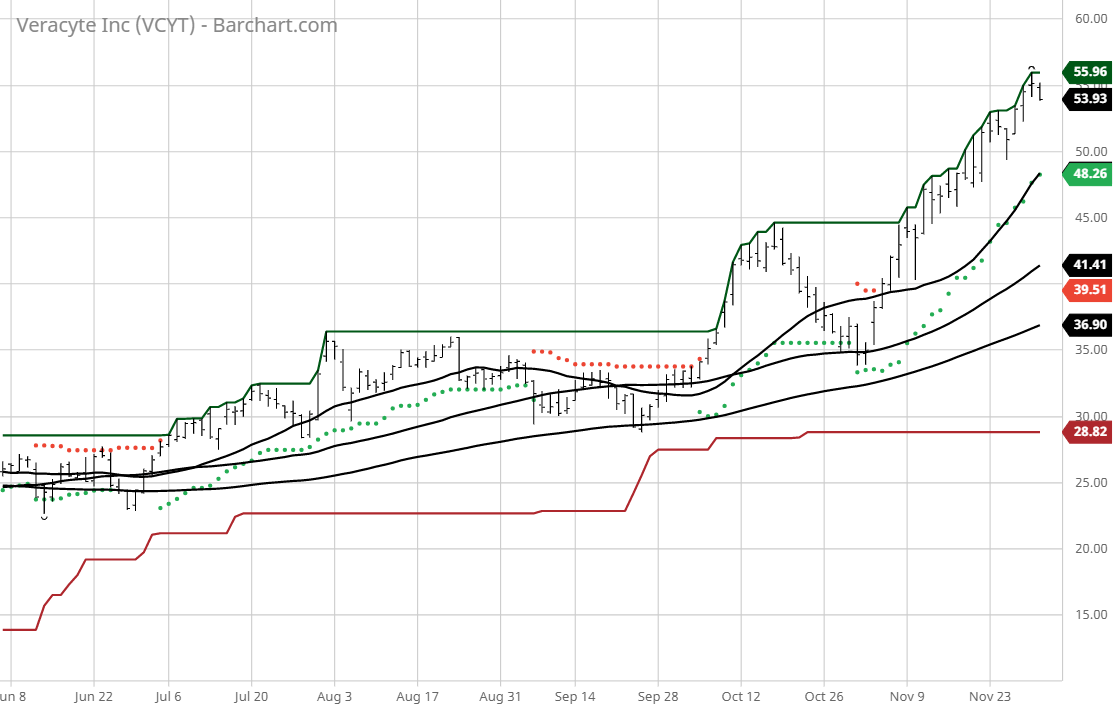
The Barchart Chart of the Day belongs to the healthcare biotechnology company Veracyte (Nasdaq: VCYT). I found the stock by using Barchart's powerful screening tools to find the stocks with the highest Weighted Alpha and technical buy signals. After I sorted for the most frequent number of new highs in the last month, I used the Flipchart feature to review the charts for consistent prices appreciation. Since the Trend Spotter signaled a buy on 11/4 the stock gained 54.89.
Veracyte, Inc. operates as a genomic diagnostics company in the United States and internationally. The company offers Afirma Genomic Sequencing Classifier and Xpression Atlas, which are used to identify patients with benign thyroid nodules among those with indeterminate cytopathology results in order to rule out unnecessary thyroid surgery; Percepta Genomic Sequencing Classifier for lung cancer; Envisia Genomic Classifier that help physicians to differentiate idiopathic pulmonary fibrosis from other interstitial lung diseases without the need for surgery; and Prosigna Breast Cancer Prognostic Gene Signature Assay test for assessing risk of distant recurrence. It sells its products through product specialists, account managers, and medical science specialists. Veracyte, Inc. has a strategic collaboration with Johnson & Johnson Innovation and the Lung Cancer Initiative at Johnson & Johnson to advance the development and commercialization of novel diagnostic tests to detect lung cancer at its earliest stages; a research collaboration with Loxo Oncology for the development of therapies for patients with genetically defined cancers; and a collaboration with Johnson & Johnson Services, Inc. The company was formerly known as Calderome, Inc. and changed its name to Veracyte, Inc. in March 2008. Veracyte, Inc. was incorporated in 2006 and is headquartered in South San Francisco, California.
Barchart's Opinion Trading systems are listed below. Please note that the Barchart Opinion indicators are updated live during the session every 10 minutes and can therefore change during the day as the market fluctuates. The indicator numbers shown below therefore may not match what you see live on the Barchart.com website when you read this report.
Barchart technical indicators:
- 100% technical buy signal
- 93.80+ Weighted Alpha
- 99.37% gain in the last year
- Trend Spotter buy signal
- Above its 20, 50 and 100 day moving averages
- 16 new highs and up 54.89% in the last month
- Relative Strength Index 74.80%
- Technical support level at 54.19
- Recently traded at 54.19 with a 5 day moving average of 41.41
Fundamental factors:
- Market Cap $3.20 billion
- Revenue expected to grow 32.10% next year
- Earnings estimated to increase 49.20% next year
- Wall Street analysts issued 3 strong buy, 1 buy and 2 hold recommendations on the stock
- The individual investors following the stock on Motley Fool voted 31 to 7 that the stock will beat the market
- 2,850 investors are monitoring the stock on Seeking Alpha
The Barchart Chart of the Day highlights stocks that are experiencing exceptional current price appreciation. They are not intended to be buy recommendations as these stock are extremely volatile and speculative. Should you decide to add one of these stocks to your investment portfolio it is highly suggested you follow a predetermined diversification and moving stop loss discipline that is consistent with your personal investment risk tolerance and reevaluate your stop losses at least on a weekly basis.
Disclosure: None.


