Valuing Equal Weight
We have previously discussed the impact of Equal Weight’s rebound on its exposure to the momentum factor. We now turn our attention to its exposure to the value factor, as the recovery in smaller caps and value stocks has been an important tailwind for the strategy. The S&P 500® Equal Weight is typically biased toward the value factor partly because of its size and anti-momentum tilts. Smaller stocks tend to have lower valuations than larger stocks; by definition, at each rebalance the Equal Weight strategy buys the underperformers, which have become less expensive, and sells the outperformers, which have become more expensive.
In Exhibit 1, we calculate the spread of the index-weighted value score for the S&P 500 Equal Weight Index versus the S&P 500. As a result of Equal Weight’s value bias, this spread is generally positive, and we see that Equal Weight’s value tilt has decreased compared to a year ago, as performance has improved.
(Click on image to enlarge)

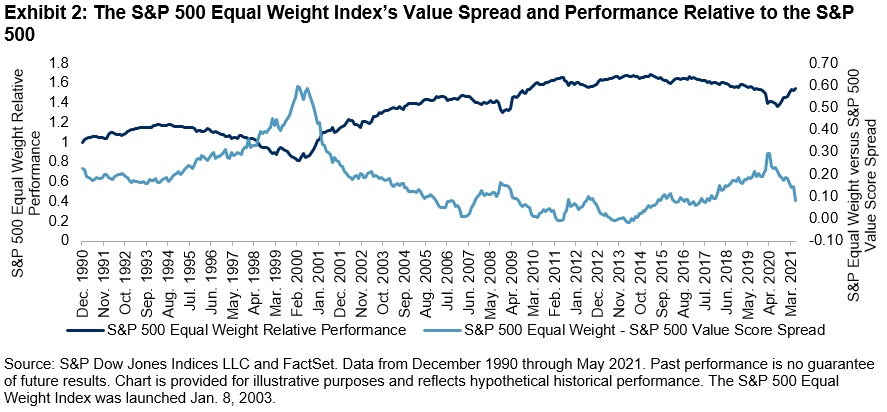
To understand the historical relationship between value and the performance of Equal Weight, we plot the value score spread alongside Equal Weight’s relative performance in Exhibit 2. As we noted earlier, this spread is almost always positive. Second, we observe a strong inverse relationship; as the value spread between Equal Weight and the S&P 500 widens, Equal Weight tends to underperform, as we saw during the tech bubble. Recently, the spread has decreased, coinciding with Equal Weight’s recovery. This intuitively makes sense, as large caps have become less expensive relative to smaller caps.
(Click on image to enlarge)

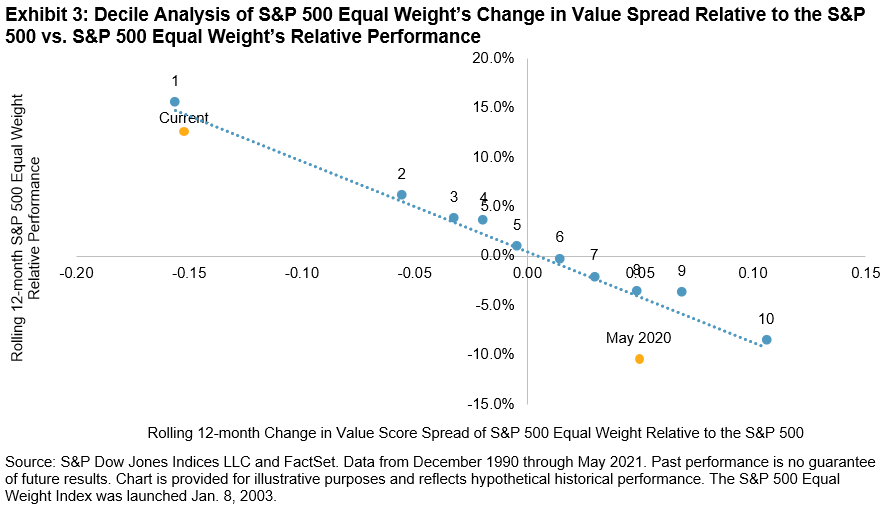
To provide further historical context, we group our database into deciles by their rolling 12-month change in value spread, and in Exhibit 3, we plot the average change in value spread on the x-axis and the average relative performance of Equal Weight on the y-axis. We again see an inverse relationship between changes in Equal Weight’s value spread and its relative performance compared to its cap-weighted counterpart.
The current environment is situated close to decile 1, indicating that Equal Weight has become relatively more expensive compared to its cap-weighted counterpart. Interestingly, a year ago, Equal Weight was positioned at decile 8, highlighting the rapidity of the strategy’s rebound.
(Click on image to enlarge)

While we do not know whether the longevity of the value rally is nearing a peak or how sustainable the recovery of smaller caps is, we can look to history to provide perspective on Equal Weight’s current factor environment. If Equal Weight’s outperformance continues, we can anticipate a further decrease in its exposure to value.
Disclaimer: Copyright © 2021 S&P Dow Jones Indices LLC, a division of S&P Global. All rights reserved. This material is reproduced with the prior written consent of S&P DJI. Please ...
more


