
Value Investing Still Beats Growth Investing, Historically
A few weeks ago I saw comments on Twitter regarding the Russell 3,000 Value and Growth indices having approximately the same returns since inception.
For example, here is Ben Johnson from Morningstar 1
1/2 - Annualized total returns from 12/29/78 - 4/9/2021:
— Ben Johnson, CFA (@MstarETFUS) April 13, 2021
- Russell 3000 Growth - 12.11%
- Russell 3000 Value - 12.09%
It is almost as though value and growth are two sides of the same coin...
As viewed from this tweet, and is born out in the data for the Russell indices, it appears that Value investing has no edge relative to growth investing over the past 40+ years! 2
So once again its valid to ask--is Value investing dead?
To test this, I followed the exact same methodology in my post last August: Value Investing: An Examination of the 1,000 Largest Firms.
One big change--I am now examining the 3,000 largest firms, not the 1,000 largest firms.
Is value dead?
Long story short: No.
As is shown below, when splitting firms in half on one simple value measure, the Price-to-Earnings ratio (P/E), Value has a historical edge over Growth.
What is Value Investing?
There are many forms of value investing and different investors have different definitions (i.e., stock pickers vs. quants). However, in this article, we outline what we mean by 'value investing' upfront. 3
Value investing is simply trying to buy stocks that are cheaper when compared to other stocks on a given fundamental/price metric. This is a common approach to defining value and growth investing in academic research.
But what does it mean for a stock to be cheap?
Let us look at a simple example. Pretend that there are only 4 stocks in the universe in which we can invest. We are going to simply look at the firms’ earnings each year, and compare that to the price one would pay if you bought the entire company's equity (i.e. the firm's market capitalization). This is the simple P/E ratio.
4 Stock Example:
- Stock 1: Earnings = $100, Market Cap = $1000, Price/Earnings = 10
- Stock 2: Earnings = $50, Market Cap = $1000, Price/Earnings = 20
- Stock 3: Earnings = $25, Market Cap = $1000, Price/Earnings = 40
- Stock 4: Earnings = $10, Market Cap = $1000, Price/Earnings = 100
So in my simple 4-stock example, Stocks 1 and 2 trade at a lower multiple of earnings relative to Stocks 3 and 4. A systematic Value investor, who only uses the P/E multiple, would prefer Stocks 1 and 2 compared to Stocks 3 and 4.
As a shopping example, Stocks 1 and 2 are “on-sale” compared to stocks 3 and 4. All 4 firms have the same market cap, but firms 1 and 2 make more $ (earnings) each year. So they "value" or "cheap" stocks.
Of course, my example above is very simplified and we are only looking at one point-in-time number--past year's earnings.
Firms 3 and 4 may be growing at a faster rate, and we can create more advanced models to try to figure out the “best” investment. However, if it were the case that experts can create better models, then active managers wouldn’t lose to the market ~ 80% of the time over 5 years.
Academics have studied how Value stocks perform relative to Growth stocks. In general, they use the book value of assets divided by the market cap of the firm, as this was the measure used in the seminal 1992/1993 Fama and French papers.
What did they find?
They found that Value stocks outperformed Growth stocks. In the original paper, they highlight that this is most likely compensation for taking on additional risk (to underscore that this is not a free lunch). 4
Of course, one can use other measures to identify cheap stocks, besides P/E and B/M. We examined different methods here. However, the big picture takeaway was the following -- Value beat Growth.
A Simple Test--Split the 3,000 Largest Firms on P/E
As highlighted in my other post, the Russell indices use a combination of various Value metrics. Full details on their indices can be found in the PDF here.
However, back to the simplest way to test the "Value" factor--let's split the 3,000 firms evenly on one value metric--price-to-earnings (P/E).
Quick Data Description--I annually rebalance the portfolio on 6/30, using the firm’s market cap to identify the 3,000 largest firms. Firms’ earnings' values were brought in as of 6/30 of each year, while only examining data available as of 3/31 each year. 5 This was done to eliminate a “look-ahead” bias.
All portfolios shown use market-cap weightings, or value-weighting in the academic parlance.
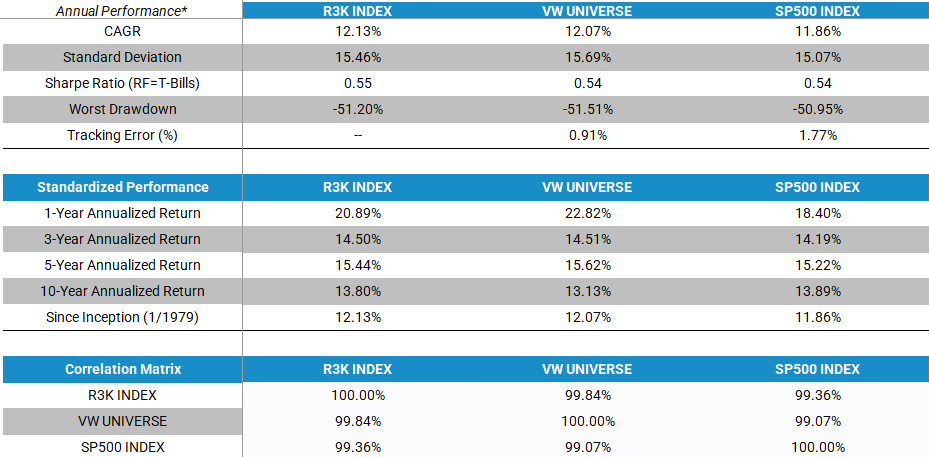
First, let's examine our Universe returns against the Russell 3,000--to ensure that we are examining approximately the same universe of stocks. 6The "VW Universe" below is the total returns to the universe of stocks I am examining when value-weighted or market-cap weighted. Of note, all portfolios shown in this article are gross of any fees or transaction costs and include distributions.
1/1/1979 - 12/31/2020:
(Click on image to enlarge)
The results are hypothetical results and are NOT an indicator of future results and do NOT represent returns that any investor actually attained. Indexes are unmanaged, do not reflect management or trading fees, and one cannot invest directly in an index.
As we can see above, the value-weighted universe returns (market-cap weighting the stocks) are very close to the Russell 3,000 Index when examining multiple aspects--such as (1) returns, (2) standard deviation, and (3) correlations. This is also similar to the S&P 500 Index. 7
Thus, we have ensured the universe is similar.
So how did Value do versus Growth?
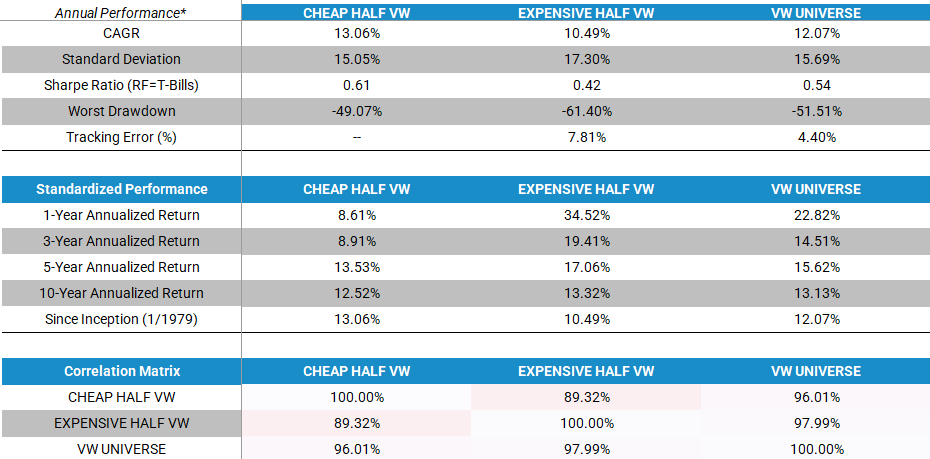
To test this, I first split the universe on one metric--the P/E ratio. So ~ 1,500 stocks are Value and ~1,500 stocks are Growth.
Portfolios are formed once a year on 6/30 and held for 12 months.
Below is the performance of Value versus Growth from 1/1/1979-12/31/2020:
(Click on image to enlarge)
The results are hypothetical results and are NOT an indicator of future results and do NOT represent returns that any investor actually attained. Indexes are unmanaged, do not reflect management or trading fees, and one cannot invest directly in an index.
As shown above--Value beat Growth by around 2.5% over the 40+ year period.
Hence the academic "Value" factor. 8
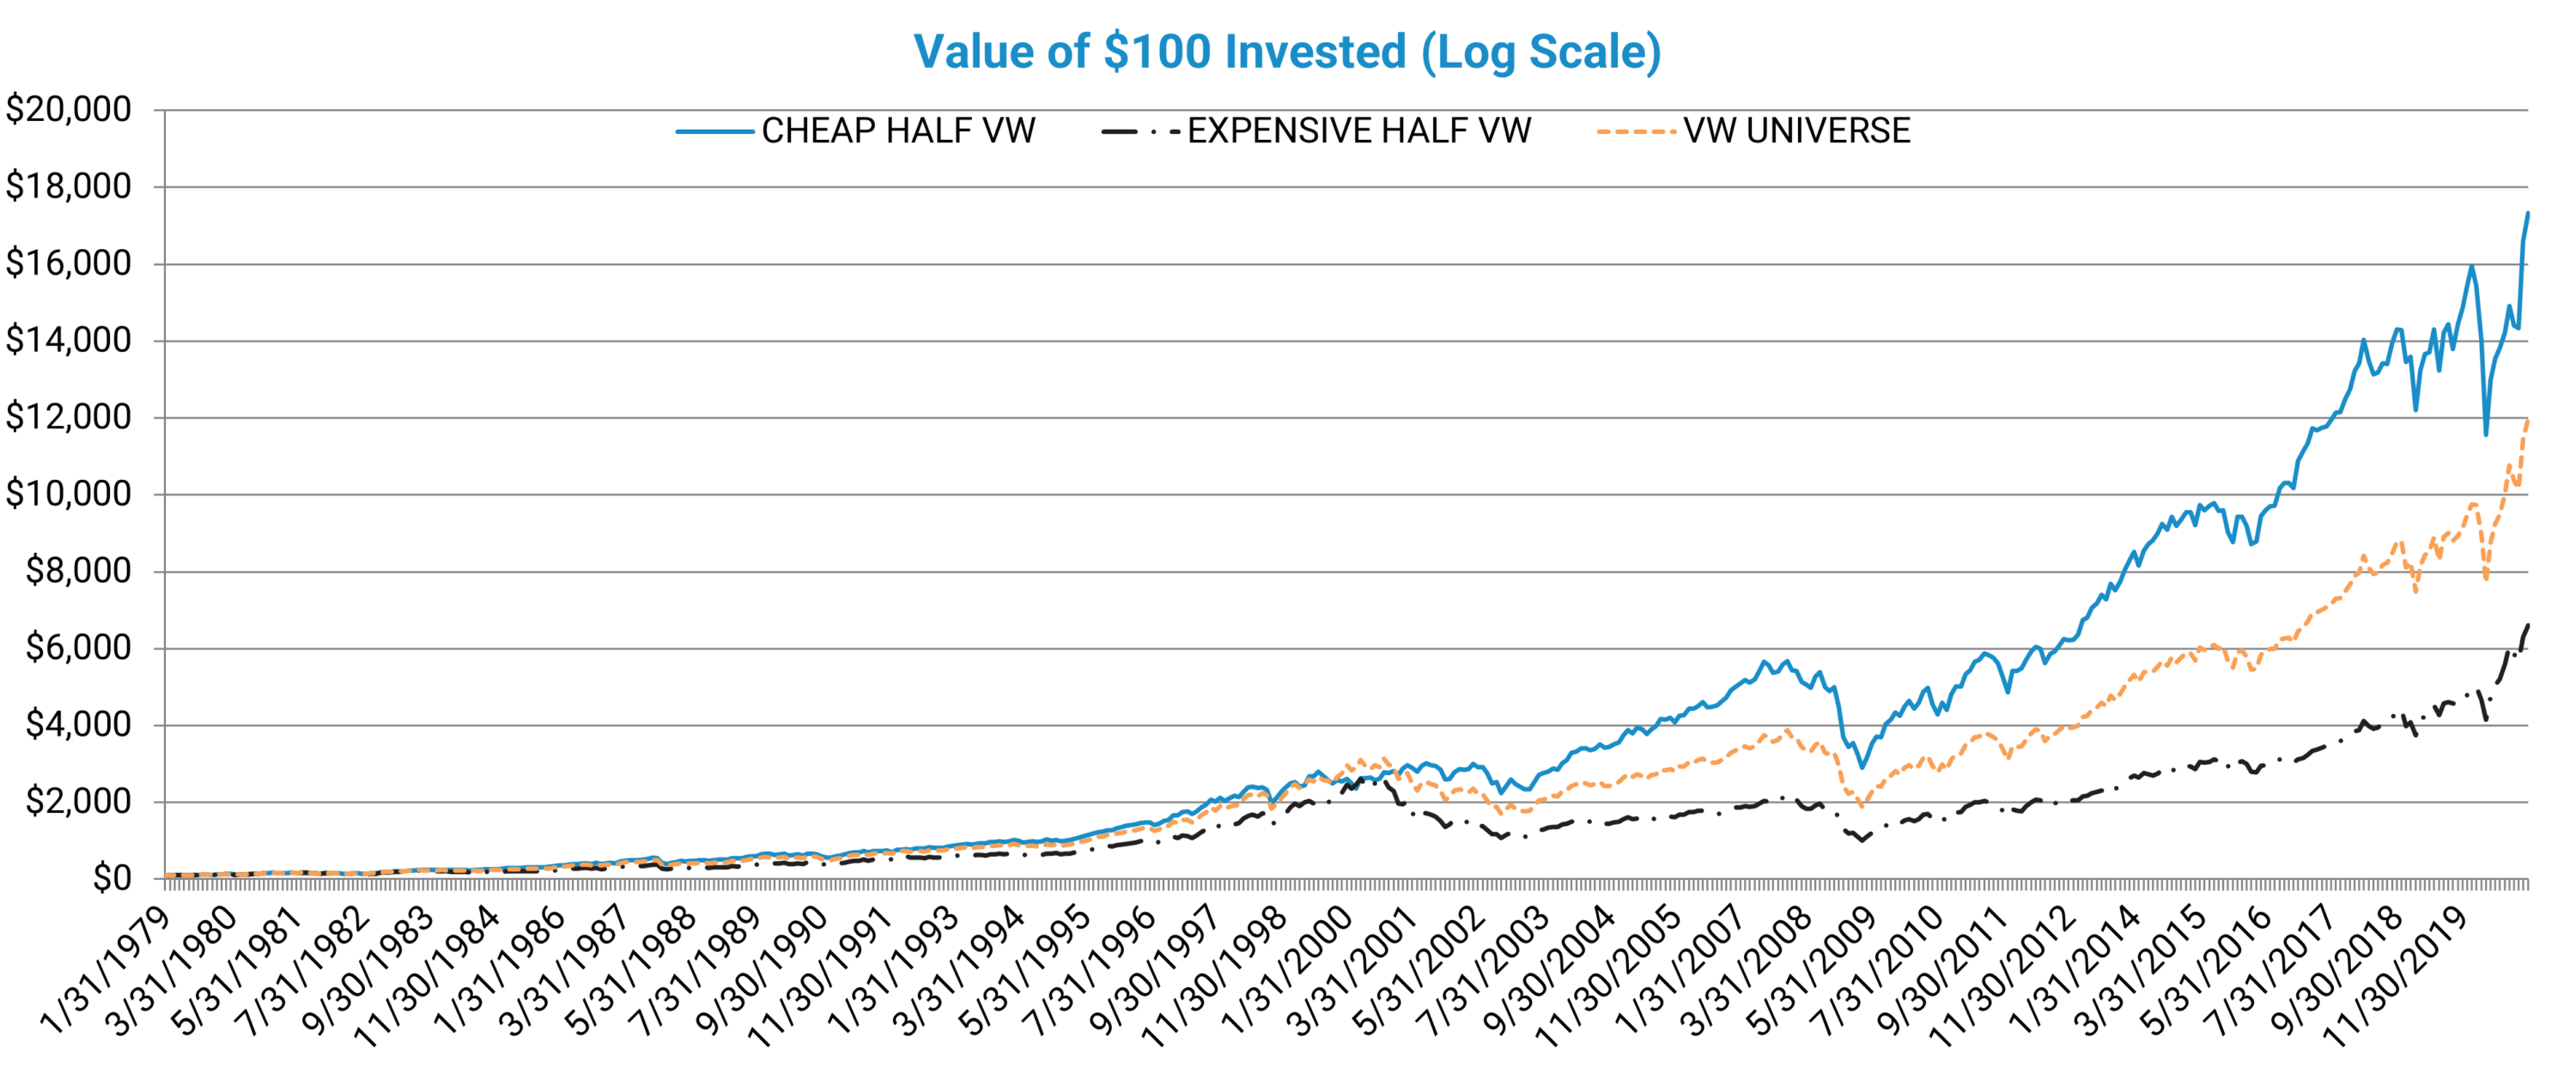
Just to emphasize what 2.5% is over a 40+ year period, here is the (non-log) scale growth over the entire sample of 1/1/1979-12/31/2020:
(Click on image to enlarge)
The results are hypothetical results and are NOT an indicator of future results and do NOT represent returns that any investor actually attained. Indexes are unmanaged, do not reflect management or trading fees, and one cannot invest directly in an index.
Once again--historically, Value did better than growth.
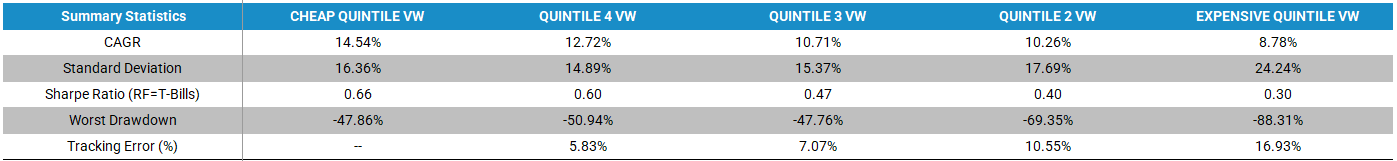
However, as opposed to simply picking the top half on Value, what happens if we split the universe into 5ths (Quintiles).
The performance is shown below from 1/1/1979-12/31/2020:
(Click on image to enlarge)
The results are hypothetical results and are NOT an indicator of future results and do NOT represent returns that any investor actually attained. Indexes are unmanaged, do not reflect management or trading fees, and one cannot invest directly in an index.
As shown above, as we move from cheap to expensive (left to right above), the historical performance drops.
The same is true when examining deciles, terciles (3rds), and equal-weighting the portfolio. 9
But--as with anything active, there will be times of underperformance.
As we have stated before, while simple, it may not be easy.
Below is the performance of the same Quintile Portfolios over the past ten years:
1/1/2011-12/31/2020
(Click on image to enlarge)
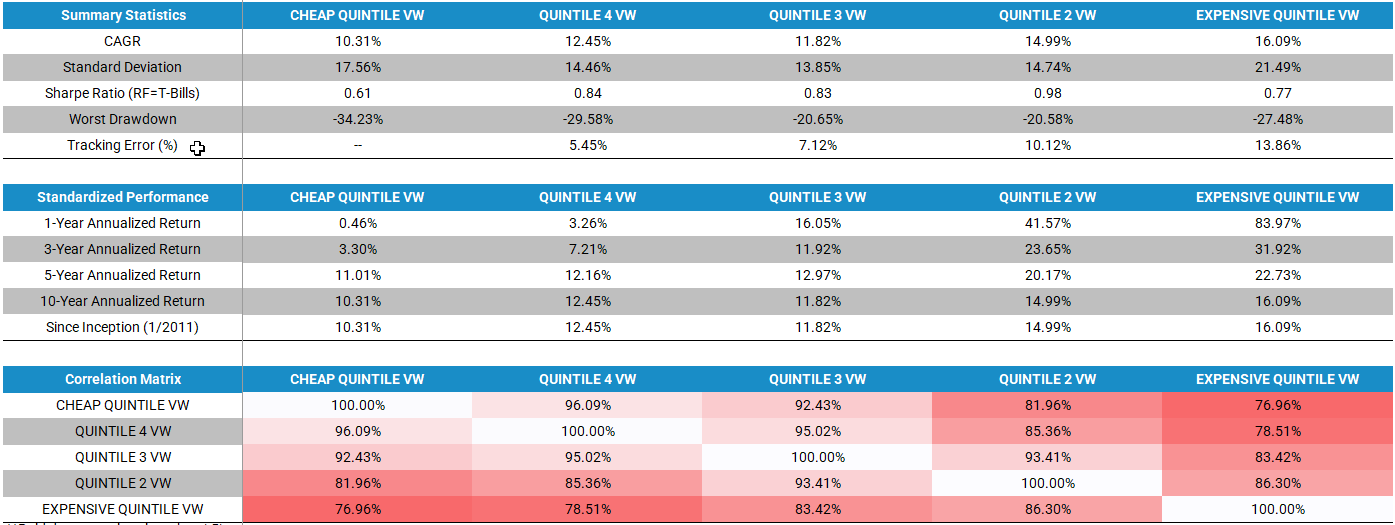
The results are hypothetical results and are NOT an indicator of future results and do NOT represent returns that any investor actually attained. Indexes are unmanaged, do not reflect management or trading fees, and one cannot invest directly in an index.
The returns are almost monotonically the opposite--Growth beat Value. The same happened from 1/1/1994-12/31/1999.
Thus, the Value factor will at times underperform. However, over the full sample, Value beat Growth.
Conclusion
This article was meant to serve as a quick check on the following question--amongst the 3,000 largest firms, did Value beat Growth investing?
The answer is yes.
The analysis above shows that a very simplistic split using the P/E multiple generated ~ a 2.5% spread between Value and Growth over a 40+ year period. When using Quintiles, the spread was ~5.75%. For deciles, the spread was ~7.4%. 10
However, there is no free lunch.
Value investing will underperform (1) growth and (2) the market at times.
Disclaimer: Performance figures contained herein are hypothetical, unaudited and prepared by Alpha Architect, LLC; hypothetical results are intended for illustrative purposes only. Past ...
more

