
US Stock Market: Beware Of A February Skid
In our December 19th Stock Market Update & Asbury Investment Management Video, we pointed out that the benchmark S&P 500 (SPX) had just survived an early December test of underlying support near 3077 amid improving market internals. The US broad market index has since risen by another 56 points or 2% into today’s highs.
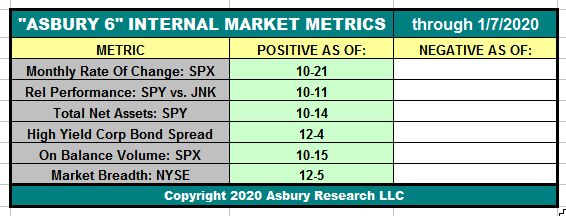
Those positive market internals, as measured by our Asbury 6 tactical model shown in Table 1 below, are all currently positive. Moreover, the table shows that 4 of 6 of them have actually been positive since mid-October.
(Click on image to enlarge)
As long as this continues to be the case, our currently bullish tactical bias on the US stock market will remain intact.
However, it’s equally important to understand what kind of strategic environment the market is in. The S&P 500 is currently in the 11th year of a bull market that historically lasts about 4 1/2 years, equity option put/call ratios are historically very low (meaning there is little interest in buying insurance against a market decine), and the annual seasonal trend in the S&P 500 — as shown in Chart 1 below — starts to weaken in January and becomes even weaker in February, which is the 4th weakest month of the year.
(Click on image to enlarge)

So, even though our tactical models remain positive, we are cautioning investors about getting too aggressive at these levels — just in case the market’s long term seasonal tendency of January-February weakness play out again this year, just as it did back in 2016.
Disclosure: None.


