
US Stock Market At A Major Decision Point - Thursday, May 7
The next best thing to knowing what the stock market is going to do next — which no one knows — is correctly identifying when it is at an important inflection point. We believe the benchmark S&P 500 (SPX) it at a major inflection point right now — from which its next one to several month directional move, higher or lower, is likely to begin.
Since bottoming on March 23rd, SPX has risen by 35% into the late April highs. This rally has resulted in a test of what we consider to be major overhead resistance at 2938 to 3002 as highlighted in Chart 1 below. These levels represent a key percentage retracement of the entire February collapse (pink) and the 200-day moving average (orange), the latter a widely watched major trend proxy. The US broad market index would have to rise and remain above 2938-3002 to indicate its long term 2009 advance has resumed. Put another way, as long as this overhead resistance area is not broken, the late March rally is just a correction in an uncompleted major downtrend.
(Click on image to enlarge)
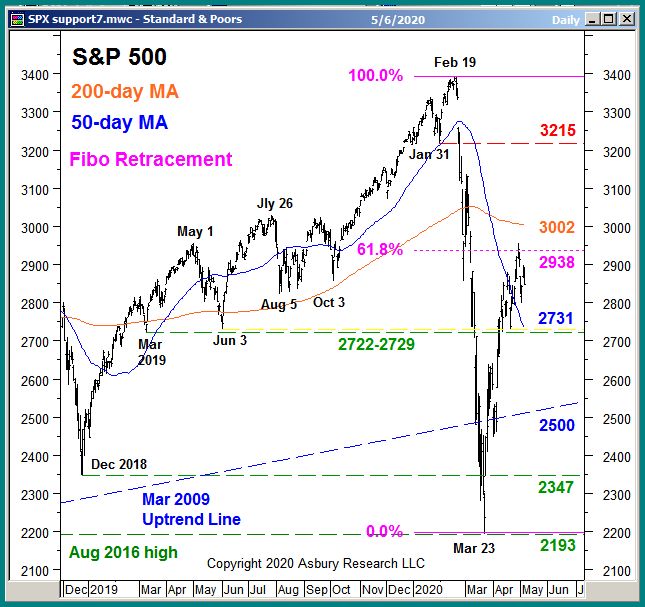
Chart 1
Below the market, the blue and green highlights show that minor underlying support exists at 2731 to 2722, which represents the 50-day moving average (minor trend proxy) and the June and March 2019 benchmark lows. A breakdown back below this level would indicate the larger February decline is resuming.
Now that we have determined where the key levels are, the next thing is to decide what to do about it. For this, we rely on our tactical models, the Correction Protection Model (CPM) and the Asbury 6. Table 1 below displays the current status of the Asbury 6 through May 6.
(Click on image to enlarge)
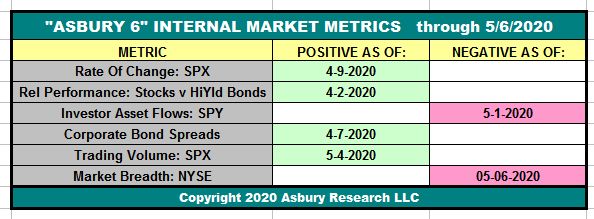
Table 1
The Asbury 6 is a combination of six diverse market metrics that we use as a lie detector test for the market — to help identify real, sustainable market advances or declines from computer-driven traps for investors. We created the Asbury 6 primarily because algorithmic trading now accounts for about 80% of the daily volume in the US stock market. Many of these computer-generated trading programs are designed to prey on human investors by causing quick, sharp moves in financial asset prices that provoke people to make emotionally driven, ill-timed trading decisions to enter or exit the market at the worst possible times and places. The Asbury 6 is designed to look past the day-to-day noise of the market to determine its real “under-the-hood” condition.
The Asbury 6 shifted to a Positive status on April 6, after previously being Negative since February 24th. The table shows that four of the “A6” are currently green, the minimum necessary for a Positive signal, but is also showing some weakness from investor asset flows and market breadth,
As long as at least four of the A6 remain green/Positive, we will expect overhead resistance at 2938 to 3002 to eventually be broken — and this would clear the way for even more strength. If four or more of the A6 turn red/Negative, however, it will warn that the late March rally is over and the larger February decline is resuming.
Disclosure: None.


