
US Equities Relatively Immune To Trade-War Risk … So Far
The US-China trade war is taking a toll on investor sentiment, but most of the blowback for world stock markets has been borne outside the US, based on year-to-date results for a set of exchange-listed products that represent the global economy’s primary economic regions.
The relative strength for US shares could quickly fade in the weeks ahead, depending on how Donald Trump’s impulsive and unpredictable decision-making process on trade unfolds. But for the moment, the US market remains an outlier on the upside compared with the rest of the world in 2019.
SPDR S&P 500 (SPY), a US proxy, is up a strong 15.9% year to date through yesterday’s close (Aug. 27). Although the fund has fallen from its record close in late-July, the decline has been modest so far. Compared with the rest of the world, SPY’s year-to-date rise still ranks as the best of the bunch by a (mostly) sizable margin.
(Click on image to enlarge)
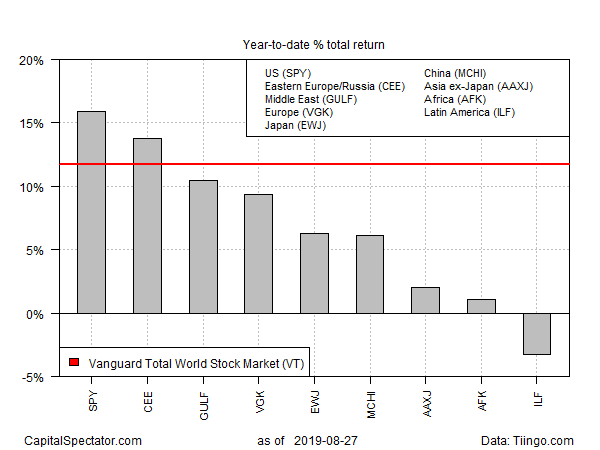
The next-best regional equity performer this year is Eastern Europe/Russia via Central and Eastern Europe (CEE), a closed-end fund that offers the only US-exchange-listed product targeting the region. As of Aug. 27, CEE is up 13.7% this year, modestly behind SPY.
The year-to-date results fade from there, although all but one of the regional proxy funds are still posting gains this year. The one exception on the downside is iShares Latin America 40 (ILF), which recently fell into negative terrain for 2019 and is currently posting a mild 3.3% year-to-date loss.
In the wake of President Donald Trump’s latest chaotic round of decisions on trade, suffice to say that sentiment generally is vulnerable as a new round of tariffs are set to kick in on Sep. 1.
“Hope gave way to pragmatic realism about the outlook for the China-U.S. trade dispute,” advises Greg McKenna at McKenna Macro in a research note today. “The market is still trying to get a feel for where it’s at and what it thinks as we get closer to the deadline for the tariffs this week.”
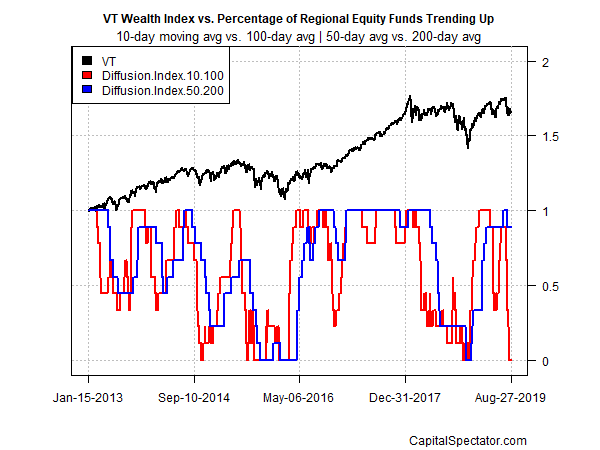
Meanwhile, short-term momentum indicators for the funds listed above are flashing across-the-board warnings of weakness ahead. In all cases, the 10-day moving average has fallen below the 100-day average (red line in chart below). For now, an intermediate measure of the trend (via second set of moving averages for 50 and 200 days) still reflects a mostly bullish profile (blue line). If and when the intermediate trend starts to give way, the trend outlook will deteriorate further.
(Click on image to enlarge)
Disclosure: None.


