
Unfit For Fiduciaries
One of the greatest beneficiaries of the COVID-19-related disruptions have been home fitness equipment companies. Long term, the fitness market may be forever changing, but this firm’s first-mover advantage is over. Future revenue and profit growth are sure to slow as larger competitors move in for their piece of the pie. Fiduciaries should avoid this week’s Danger Zone pick: Peloton Interactive Inc. (PTON) $90/share.
Since we first warned about the firm prior to its IPO in September 2019, the stock is up ~209% (including a ~216% gain year-to-date) while the S&P 500 is up just 11%. Investors who think that such extraordinary performance in the stock coincides with accelerating revenue growth, improved profitability, or growing competitive advantages over the long term are wrong. While Peloton’s stock performance is attractive to many momentum investors, investors with fiduciary responsibilities should consider the deteriorating fundamentals, weak competitive position, and the unrealistic profits implied by the current valuation.
This report helps investors of all types see just how extreme the risk in PTON is based on:
- New market entrants
- Pricing pressure
- Challenging demographics
- Doing the math: Peloton will need to grow revenue faster than Netflix and the iPhone in their heyday
Sales Spiked Last Quarter Due to COVID-19 Lockdowns
From 3Q19 to 3Q20, Peloton’s year-over-year (YoY) revenue growth rate fell from 122% to 66%. While 4Q20 saw a dramatic uptick in sales (172% YoY), we believe this jump is temporary and related to COVID-19 boosting sales as many gyms shuttered and consumers adjusted to working out at home.
Figure 1: Peloton’s YoY Revenue Growth Since 1Q19
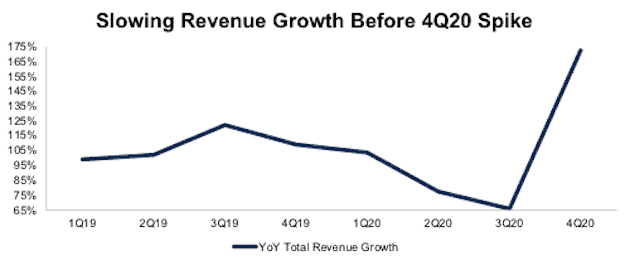
Sources: New Constructs, LLC, and company filings
First-Mover Advantage Will Not Last
Peloton likes to tout its first-mover advantage, but a closer look at the competition reveals that Peloton was neither the first at-home fitness equipment manufacturer, nor the last to integrate interactive classes into its equipment. Figure 2 lists just some of the competitors selling connected fitness equipment along with cost comparisons.
Figure 2: Peloton’s Competition Is Plentiful
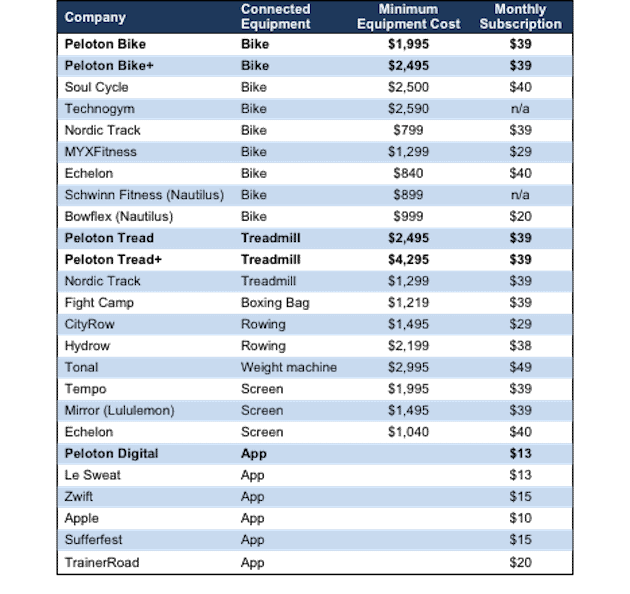
Sources: New Constructs, LLC, and SumZero Idea by Sharif Farha
Of particular concern for Peloton should be Lululemon (LULU) and Apple (AAPL), both of which boast large dedicated customer bases. Lululemon’s purchase of Mirror this year is particularly timely as the firm’s online engagement with its customers has soared. Lululemon’s e-commerce sales accounted for 61% of total sales in 2Q20 vs. just 25% in 2Q19. Lululemon can leverage its recent online engagement success by marketing the Mirror and its subscription service to its captive customer base. Lululemon reported reaching 72 million guests through its online “sweat and mindfulness hub” in 2019 alone.
Apple recently announced its new Apple Fitness+ service, which for now requires an Apple Watch. While Apple has shipped more than 53 million watches over the past two years, there are over one billion people using Apple devices worldwide giving the firm a strong customer base to which it can market its new Apple Fitness+ service in the future. For comparison, Peloton celebrated their one millionth subscriber at the end of fiscal 4Q20. Apple can further facilitate adoption of Apple Fitness+ by bundling it with other services, such as the recently announced Apple One, which bundles Apple Music, Apple TV, Apple Fitness+ and more of Apple’s apps.
Peloton’s an Equipment Maker With Dreams of Becoming a Streaming Service
With so many companies lining up to compete with connected fitness equipment – many of which at lower price points – Peloton is focused on refining its content as a way to differentiate itself from the competition. With a stated goal of reaching 100 million subscribers, it is safe to say that Peloton aspires to be the “Netflix” of fitness. For reference, Netflix (NFLX) had 193 million paying streaming subscribers at the end of 2Q20.
However, Peloton’s Netflix-like aspirations don’t coincide with the actual operations of its business. Peloton generates 80% of its revenue from connected fitness equipment, per Figure 3.
Figure 3: Peloton’s Sales Mix: Equipment & Subscription
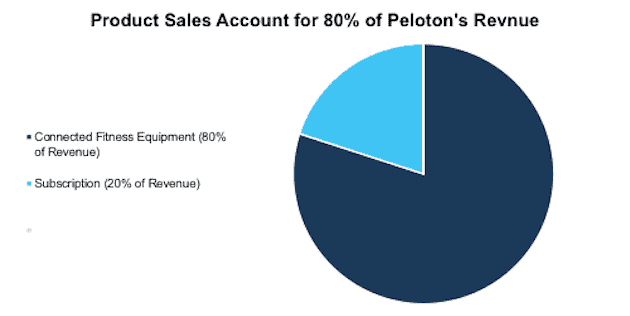
Sources: New Constructs, LLC
Demographic Trends Are Shifting Away From Peloton’s Core Consumer
Peloton primarily offers high-end, large connected fitness equipment with a $39/month subscription service that is most appealing to more affluent market segments. However, biking is growing among the less affluent segments. According to Peloton, the share of the bike market from consumers with household incomes greater than $100 thousand per year has fallen from 71% in fiscal 2014 to 54% in fiscal 2020.
While Peloton may view this shift as an opportunity to engage a new segment of the market, the firm is less likely to achieve the same level of popularity with its current premium pricing model as it has with a more affluent market. As Peloton strives to be more competitive with this growing segment, it may be forced to lower prices, thereby pressuring profitability, or risk shrinking its available market, which makes achieving high-growth rates all the more difficult.
Figure 4: Biking Consumers Making Less Than $100K Are Gaining Share of the Market
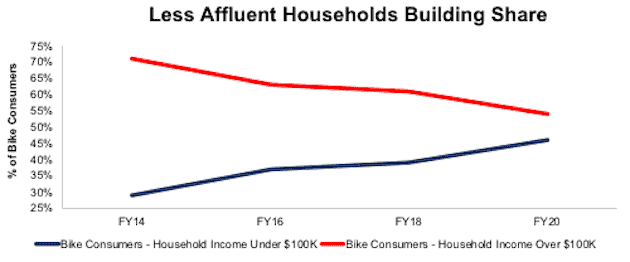
Sources: New Constructs, LLC, and company filings & Investor Relations
Peloton’s Losses Keep Adding Up
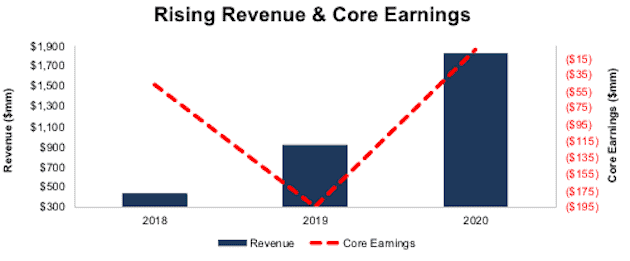
Peloton’s most recent investor day presentation states that the firm will prioritize connected fitness subscription over profitability. It should come as no surprise then that even with soaring revenue, the firm’s core earnings are still negative. Per Figure 5, Peloton has grown revenue by 105% compounded annually since fiscal 2018. While core earnings[1] fell from -$47 million in fiscal 2018 to -$194 million in fiscal 2019, they rose to -$4 million in fiscal 2020.
Figure 5: Peloton’s Revenue and Negative Core Earnings Since 2018
Sources: New Constructs, LLC, and company filings
Peloton has also had negative free cash flow (FCF) in each of the past two years. Since 2018, the firm has burned a cumulative $624 million (2% of market cap) in FCF.
Peloton’s Peers Are Far More Profitable
While much of Peloton’s competition listed in Figure 2 is privately owned, we have chosen Apple (APPL), Lululemon Athletica Inc. (LULU), Netflix Inc. (NFLX), Planet Fitness (PLNT), and Nautilus Group Inc (NLS) as the firm’s peer group. These firms directly compete with Peloton, have similar business models, or both.
Peloton’s net operating profit after-tax (NOPAT) margin of less than 1% is well below the market-cap-weighted peer group average margin of 20%. The only other peer in the single digits is fellow fitness equipment maker, Nautilus Group.
Peloton’s invested capital turns, a measure of balance sheet efficiency, ranks fourth out of the six companies listed in Figure 6, while its return on invested capital (ROIC) ranks last amongst peers at less than 1%.
Figure 6: Peloton’s Peers Are More Profitable
| Company | Ticker | NOPAT Margin | IC Turns | ROIC | Existing Users |
| Apple Inc. | AAPL | 20% | 5.2 | 106% | 1 billion |
| Lululemon Athletica inc. | LULU | 14% | 1.7 | 24% | 72 million |
| Netflix Inc. | NFLX | 14% | 1.0 | 14% | 193 million |
| Planet Fitness Inc | PLNT | 20% | 0.7 | 14% | 15 million |
| Nautilus Group Inc | NLS | 4% | 1.4 | 5% | N/A |
| Peloton Interactive Inc. | PTON | <1% | 1.6 | <1% | 1 million |
| Market-Cap-Weighted Average of Peers | 20% | 4.7 | 96% |
Sources: New Constructs, LLC, and company filings
One of the overlooked advantages that some of the peer group has over Peloton is their existing user bases. Apple tops the list with over one billion users of its devices, each of which can more easily be marketed and sold an add-on service. Netflix has built its subscribers up to 193 million. Even Planet Fitness has over 15 million members who can access free fitness classes through its app. Peloton has a much smaller user base at just over one million connected subscribers.
Defining Peloton’s Addressable Market Size
Peloton estimates its household serviceable addressable market (SAM) for connected fitness equipment to be 15 million households. Peloton obtains this number from the number of households aged 18-70 with $50 thousand or more in household income who are interested in purchasing one or more of the firm’s products at current pricing. While we believe most households earning between $50 thousand to $100 thousand a year are more likely to meet their fitness needs with less expensive options, we nonetheless optimistically use Peloton’s number of 15 million households.
Assuming each household purchases one piece of equipment at a price of $2,495 (same as the starting prices of Bike+ and Tread), then Peloton’s SAM for connected fitness equipment is valued at ~$37.4 billion. Assuming the firm sells one subscription for each piece of connected fitness equipment sold, Peloton would generate an additional $7 billion in annual subscriptions. Peloton also estimates demand for its digital subscription offer of $12.99/month to be an additional five million households. Assuming each of these additional households purchase one digital subscription, Peloton would generate an additional $779 million in revenue. In total, Peloton’s SAM is valued at ~$45.2 billion.
With $1.8 billion of revenue in fiscal 2020, Peloton’s current share of its SAM is 4%. With the influx of competitors (see Figure 2) such as Apple and Lululemon who already have established loyalty within much of Peloton’s SAM, Peloton will find gaining a greater share of its SAM increasingly difficult.
Peloton’s connected fitness equipment SAM of $37.4 billion is a very optimistic estimate. It is six times greater than Research and Markets’ 2020 valuation of the cardiovascular training segment (which includes bikes and treadmills) of the global fitness equipment market of $6.2 billion and 4.5 times greater than the $8.2 billion estimate for the same segment in 2027.
PTON Is Priced to Capture 29% of Its SAM
Despite facing new and tough competition, Peloton is priced as if it will gain a large share of its estimated SAM.
To justify its current price of $90/share, Peloton must:
- Grow revenue at 32% (vs. consensus estimates of 96% in 2021, 35% in 2022, 31% in 2023, and 18% in 2024) compounded annually over the next seven years
- Immediately achieve a 13% (above Nautilus’ 16-year high of 10%) NOPAT margin
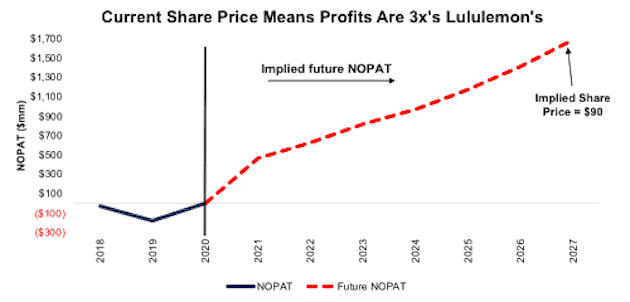
See the math behind this reverse DCF scenario. In this scenario, Peloton’s revenue in 2027 would reach $13 billion, or 29% of its SAM. In this scenario, Peloton grows NOPAT by 181% compounded annually for seven years and NOPAT in 2027 equals $1.7 billion, or three times Lululemon’s TTM NOPAT of $546 million and over 16 times Planet Fitness’ TTM NOPAT of $104 million.
Figure 7: Current Valuation Implies Unrealistic Revenue Growth
Sources: New Constructs, LLC and company filings.
Peloton Is Valued to Outpace Netflix and the iPhone’s Peak Growth Years
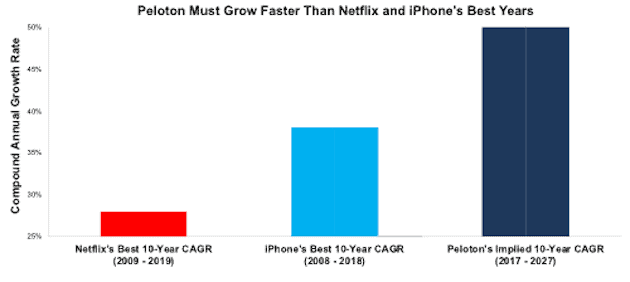
To better illustrate the growth expectations implied by Peloton’s stock price, we compare the implied revenue growth from 2017 (the earliest year in the company’s IPO prospectus) to 2027 with the best 10-year-growth periods for Netflix (streaming services) and the iPhone (connected devices). Netflix’s best 10-year-growth period, after it offered streaming services in 2007, is 2009 to 2019 with a 28% compounded annual revenue growth rate (CAGR). The iPhone’s best 10-year-growth period is 2008 to 2018 with a CAGR of 38%. Peloton’s current valuation implies the firm must grow its revenue by 50% compounded annually from 2017 to 2027, much higher than Netflix and iPhone in their best 10-year periods.
Figure 8: Current Valuation Implies Unrealistic Revenue Growth
Sources: New Constructs, LLC and company filings.
Peloton Has Significant Downside With More Realistic Expectations
If we assume more realistic revenue and profit growth, PTON has significant downside.
In this scenario, we assume Peloton will:
- Grow revenue at 28% (vs. consensus estimates of 96% in 2021, 35% in 2022, 31% in 2023, and 18% in 2024) compounded annually over the next seven years
- Immediately achieve a 7% NOPAT margin (twice Nautilus’s TTM margin of 3.5%)
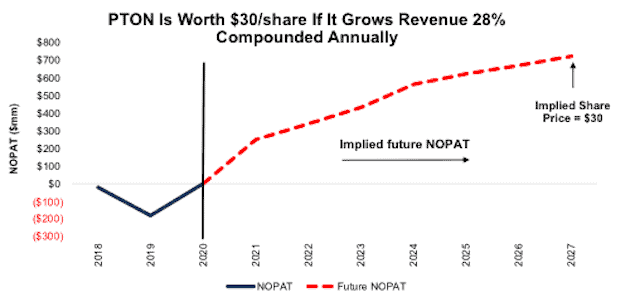
See the math behind this reverse DCF scenario. In this scenario, Peloton grows NOPAT from $1 million in 2020 to $724 million in 2027, or 149% compounded annually, and the stock is worth $30/share – a 67% downside. For comparison, Nautilus’ TTM NOPAT is just $13 million.
Figure 9: PTON Has Large Downside Risk: DCF Valuation Scenario
Sources: New Constructs, LLC and company filings.
Each of the above scenarios also assumes Peloton is able to grow revenue, NOPAT and FCF without increasing working capital or fixed assets. This assumption is highly unlikely but allows us to create best-case scenarios that demonstrate how high expectations embedded in the current valuation are. For reference, Peloton has increased its invested capital by 32% compounded annually over the past two years.
Acquisition Would Be Unwise
Often the largest risk to any bear thesis is what we call “stupid money risk”, which means an acquirer comes in and pays for Peloton at the current, or higher, share price despite the stock being overvalued. While we think competitors would be better off building rather than buying Peloton’s existing product and subscription portfolio, it’s plausible that a competitor could decide to buy Peloton. However, given the low margins and overvalued stock price, we think it would be unwise for a larger firm to acquire Peloton at current levels.
The likelihood of someone acquiring Peloton is further reduced by the low barriers to entry in the connected fitness equipment and streaming service market. The firm does not have a substantial technological or existing user base advantage which means other firms can replicate its business model easily. Nevertheless, we think it helps to quantify what, if any, acquisition hopes are priced into the stock.
Walking Through the Acquisition Math
First, investors need to know that Peloton has large liabilities that make it more expensive than the accounting numbers would initially suggest.
- $4.2 billion in outstanding employee stock options (16% of market cap)
- $598 million in total debt (2% of market cap)
After adjusting for these liabilities, we can model multiple purchase price scenarios. For this analysis, we chose Nike (NKE) as a potential acquirer of Peloton since doing so could bolster Nike’s ability to keep up with Lululemon’s pursuit of creating a lifestyle brand and recent purchase or Mirror. While we chose Nike, analysts can use just about any company to do the same analysis. The key variables are the weighted average cost of capital (WACC) and ROIC for assessing different hurdle rates for a deal to create value.
Even in the most optimistic of scenarios, Peloton is worth less than its current share price.
Figures 10 and 11 show what we think Nike should pay for Peloton to ensure it does not destroy shareholder value. There are limits on how much Nike should pay for Peloton to earn a proper return, given the NOPAT or free cash flows being acquired.
Each implied price is based on a ‘goal ROIC’ assuming different levels of revenue growth. In the first scenario, we use 97% revenue growth in year one and 33% in years two through five (vs. consensus estimates of 97% in 2021, and 33% in 2022). In the second scenario, the estimated revenue growth rate for year one is 97% and 40% in years two through five. We use the higher estimates in scenario two to illustrate a best-case scenario where we assume Peloton could grow revenue faster while being integrated within Nike’s global customer base.
We conservatively assume that Nike can grow Peloton’s revenue and NOPAT without spending any working capital or fixed assets beyond the original purchase price. We also assume Peloton achieves an 8% NOPAT margin, which equals Nike’s TTM NOPAT margin. For reference, Peloton’s TTM NOPAT margin is 0.1%.
Figure 10: Implied Acquisition Prices for Value-Neutral Deal
Sources: New Constructs, LLC and company filings
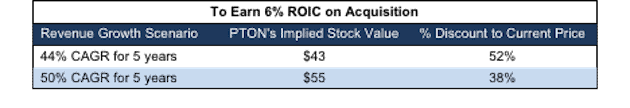
Figure 11 shows the implied values for PTON assuming Nike wants to achieve an ROIC on the acquisition that equals its WACC of 6%. This scenario represents the minimum level of performance required not to destroy value. Even if Peloton can grow revenue by 50% compounded annually for five years and achieve an 8% NOPAT margin, the firm is worth much less than $90/share. It’s worth noting that any deal that only achieves a 6% ROIC would not be accretive, as the return on the deal would equal Nike’s WACC.
Figure 11: Implied Acquisition Prices to Create Value
Sources: New Constructs, LLC and company filings
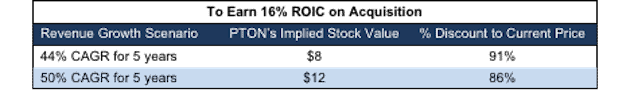
Figure 12 shows the implied values for PTON assuming Nike wants to achieve an ROIC on the acquisition that equals 16%, its current ROIC. Acquisitions completed at these prices would be accretive to Nike’s shareholders. Even in this best-case growth scenario, the implied value is far below Peloton’s current price. Without significant increases in the margin or revenue growth assumed in this scenario, an acquisition of PTON at its current price destroys significant shareholder value.
Catalyst – a Scary Market for Stocks With High Expectations
At the end of February, the consensus estimate for Peloton’s 2021 earnings was -$0.96/share. Jump forward to today, and the 2020 consensus estimate has risen all the way to $0.25/share. Peloton has missed earnings twice in the last four quarters. With higher expectations making a beat that much more difficult, another earnings miss could send shares lower.
Further, the COVID-19 bump in sales will undoubtedly give the firm a relatively strong year of performance. Consequently, YoY comparisons in 2021 will only be that much more difficult to surpass. If sales don’t grow as fast as they did in 2020, particularly when gyms begin to reopen across the country, disappointed investors might dump their shares for the next “growth story.”
Additionally, in the past four months, Lululemon and Apple have made their intentions clear about more directly competing with Peloton in the connected fitness space. Should these competitors find quick success, or if other major companies enter the space in the upcoming months, investors may leave Peloton for greener pastures.
What Noise Traders Miss With PTON
These days, fewer investors pay attention to fundamentals and the red flags buried in financial filings. Instead, due to the proliferation of noise traders, the focus tends toward technical trading tends while high-quality fundamental research is overlooked. Here’s a quick summary for noise traders when analyzing PTON:
- Significant competition in both segments in which Peloton competes
- Slowing revenue growth rate before COVID-19 pandemic
- Lack of significant and durable competitive advantages
- Valuation implies massive revenue growth over the next decade
Paying Executives Based on Adjusted EBITDA Is Bad for Shareholders
Peloton’s prospectus reveals the firm granted cash bonuses based on performance improvement in global net revenue and adjusted EBITDA in fiscal 2018 and fiscal 2019. Additionally, the firm granted $65 million worth of stock options to executives over the same time.
Adjusted EBITDA, which was positive for fiscal 2020, removes depreciation and amortization expense ($40 million in fiscal 2020) and stock-based compensation expense ($89 million in fiscal 2020) among others. No wonder management loves this metric so much. Figure 12 shows that despite achieving a positive Adjusted EBITDA in fiscal 2020, Peloton’s economic earnings, a measure of true cash flows, have remained negative over the past three years. Peloton should link executive compensation with improving ROIC, which is directly correlated with creating shareholder value, so shareholders’ interests are properly aligned with executives’.
Figure 12: Peloton’s Adjusted EBITDA vs. Economic Earnings Since 2018
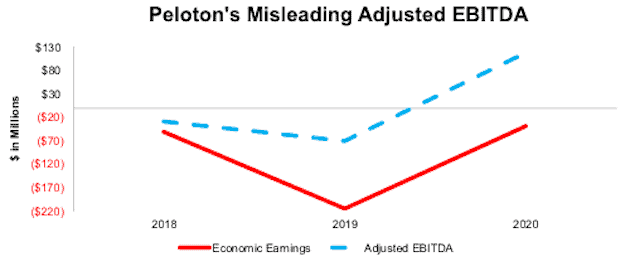
Sources: New Constructs, LLC, and company filings
Insider Trading and Short Interest
Over the past twelve months, insiders have purchased 63 million shares and sold 48 million shares for a net effect of 15 million shares purchased.
There are currently 7.4 million shares sold short, which equates to 3% of shares outstanding and less than one day to cover. The number of shares sold short has increased by 12% since last month.
Critical Details Found in Financial Filings by Our Robo-Analyst Technology
As investors focus more on fundamental research, research automation technology is needed to analyze all the critical financial details in financial filings as shown in the Harvard Business School and MIT Sloan paper, "Core Earnings: New Data and Evidence”.
Below are specifics on the adjustments we make based on Robo-Analyst findings in Peloton’s 10-K:
Income Statement: we made $115 million of adjustments, with a net effect of removing $73 million in non-operating expenses (4% of revenue). You can see all the adjustments made to Peloton’s income statement here.
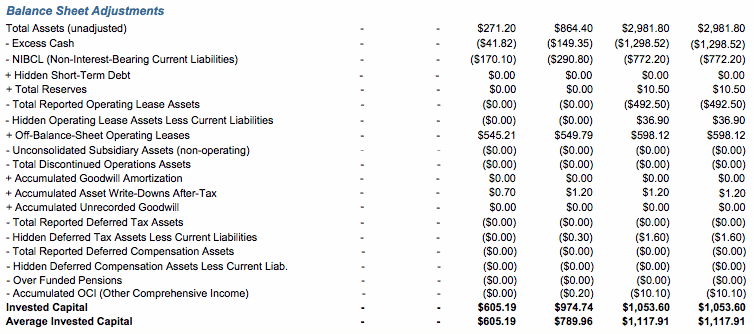
Balance Sheet: we made $1.4 billion of adjustments to calculate invested capital with a net decrease of $1.3 billion. One of the most notable adjustments was $53 million in operating leases. This adjustment represented 2% of reported net assets. You can see all the adjustments made to Peloton’s balance sheet here.
Valuation: we made $6.1 billion of adjustments with a net effect of decreasing shareholder value by $3.5 billion. The most notable adjustment to shareholder value was $4.2 billion in employee stock options. This adjustment represents 16% of Peloton’s market cap. See all adjustments to Peloton’s valuation here.
Unattractive Funds That Hold PTON
The following funds receive our Unattractive-or-worse rating and allocate significantly to PTON:
- Amplify ETF Trust: Amplify Online Retail ETF (IBUY) – 3.4% allocation and Very Unattractive rating
- BNY Mellon Small/Mid Cap Growth Fund (SDSCX) – 3.2% allocation and Very Unattractive rating
- Miller Opportunity Trust (LGOAX) – 2.7% allocation and Very Unattractive rating
- Morgan Stanley Discovery Portfolio (MSMFX) – 2.7% allocation and Very Unattractive rating
- Firsthand Technology Opportunities Fund (TEFQX) – 2.5% allocation and Very Unattractive rating
This article originally published on September 21, 2020.
Follow us on Twitter, Facebook, LinkedIn, and StockTwits for real-time alerts on all our research.
[1] Our core earnings are a superior measure of profits, as demonstrated in Core Earnings: New Data & Evidence a paper by professors at Harvard Business School (HBS) & MIT Sloan. The paper empirically shows that our data is superior to “Operating Income After Depreciation” and “Income Before Special Items” from Compustat, owned by S&P Global (SPGI).
Disclosure: David Trainer, Kyle Guske II, and Matt Shuler receive no compensation to write about any specific stock, style, or theme.


