
Two Tech Giants Announce Positive Quarterly Results
After yesterday’s close, Apple (AAPL) and Facebook (FB) announced their quarterly results. Both were better than expected by market consensus and has been well received by investors, as both companies are trading higher during the pre-opening of the market are increases close to 3% and 7% respectively.
Specifically, Apple obtained a profit per share of $1.4 and income of $89.58 billion in the period between January and March, significantly surpassing the expected $0.983 per share and $76.71 billion.
These results show the earnings growth to be driven by revenue from iPhone sales in the Mainland China region. The profit reached $23.63 billion, 110% higher than the same period in 2020.
Technically speaking, these good results may again drive the company to seek new highs if it finally manages to overcome its current resistance level of around $ 135 per share. The break of this level, could lead the price to seek its previous level of all-time highs.
As we can see in the daily chart, the price is currently at overbought levels close to its current resistance level, so these good results may boost the price despite the accumulated overbought. The uptrend seems clear after forming a bottom in the vicinity of its uptrend line in the red band that currently acts as its main supports.
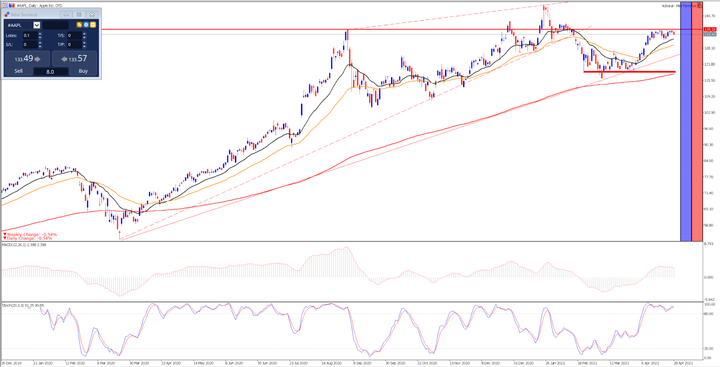
Source: Admiral Markets MetaTrader 5. Apple daily chart. from December 26, 2019 to April 29, 2021. Prepared on April 29, 2021 at 12:20 CEST. Keep in mind that past returns do not guarantee future returns.
Price evolution of the last 5 years:
- 2020: 80.75%
- 2019: 86.13%
- 2018: -6.78%
- 2017: 46.15%
- 2016: 9.99%
Shifting focus to Facebook’s results, the company reported earnings per share of $3.3 and revenue of $26.17 billion, compared to $2.33 per share and revenue of $23.63 billion, a rise of 1.88 billion thanks to its daily active users.
Net profit reached amounts to $9.497 billion dollars, 93.7% growth over the same period last year, despite the data security problems that it has had in recent weeks.
Technically speaking, this company is practically starting a new bullish momentum after bouncing off its 18-session average after making a brief correction from its previous all-time highs. These positive results can give this value wings to reach new highs.

Source: Admiral Markets MetaTrader 5. Facebook daily chart. Data range: from December 26, 2019, to April 29, 2021. Prepared on April 29, 2021, at 12:20 CEST. Keep in mind that past returns do not guarantee future returns.
Price evolution of the last 5 years:
- 2020: 33.09%
- 2019: 56.57%
- 2018: -25.71%
- 2017: 53.38%
- 2016: 9.93%
Disclaimer: The given data provides additional information regarding all analysis, estimates, prognosis, forecasts or other similar assessments or information (hereinafter ...
more

