
Tuesday Talk: The 1% Long Slide And Drop Ride
If the market indices were playground slides and you were a kid, you would have had a fun ride yesterday. The S&P 500, Dow and Nasdaq started the day with good descents, then cascaded gently up and down during the day, and ended with solid drops.

The S&P 500 and the Dow slid to descents of 0.91% and 0.89% respectively, while the Nasdaq Composite solidly dropped 1.4%.
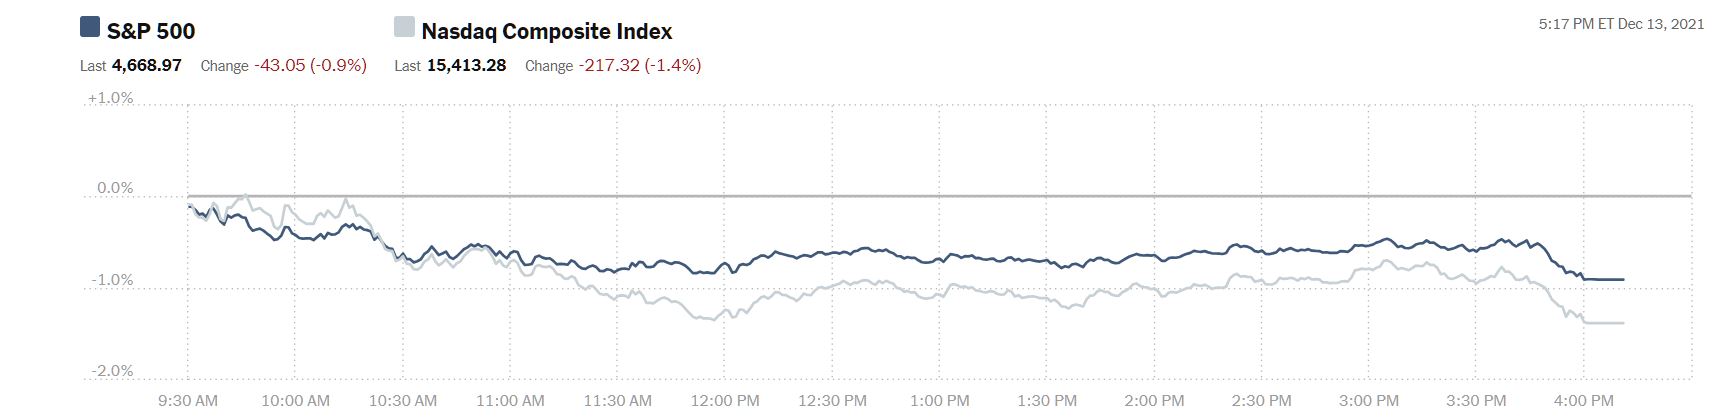
Chart: The New York Times
The S&P 500 closed at 4,669, down 43 points, the Dow Jones Industrial Average closed at 35,651, down 320 points, and the Nasdaq Composite closed at 15,413, down 217 points. Currently market futures are mixed; S&P futures are down 9 points, Dow futures are up 18 points and Nasdaq 100 futures are down 81 points.
Monday's most actives were all big board issues. COVID-19 concerns were still influencing some trades with Pfizer (PFE) gaining 4.6% and Carnival Cruise Lines (CCL) and American Airlines (AAL) both losing 4.9%.

Chart: The New York Times
Here Is The Most Important Stock Market Chart You Need To See this morning, according to TalkMarkets contributor Mike Swanson.
"Here is the most important chart in the market. It is the percentage of stocks above their 200-day moving average on the NYSE."

"This indicator completely plunged last month. It has been in a steady decline since June. When this indicator goes down it means that many stocks are falling below their 200-day moving averages and are in bear markets of their own. This indicator fades like this during a stage three top in the markets that leads to a bear market."
Swanson also, has this warning. "The fact is MANY stocks in the market that were popular earlier this year or last year are broken and fading while the S&P 500 still looks ok at a superficial glance."
Elsewhere contributor Ironman finds that U.S.-China Trade Spikes Up On U.S. Soybean Exports.
"The combined value of goods traded between the U.S. and China jumped to its highest level since before the 2019 tariff war between the two countries in October 2021."

"That's mainly on the strength of U.S. soybean exports to China, which typically peak from October through December each year. Meanwhile, U.S. imports of goods from China also rose, but could have been much higher if not for the growing backlog of container ships at the U.S.' west coast ports..."
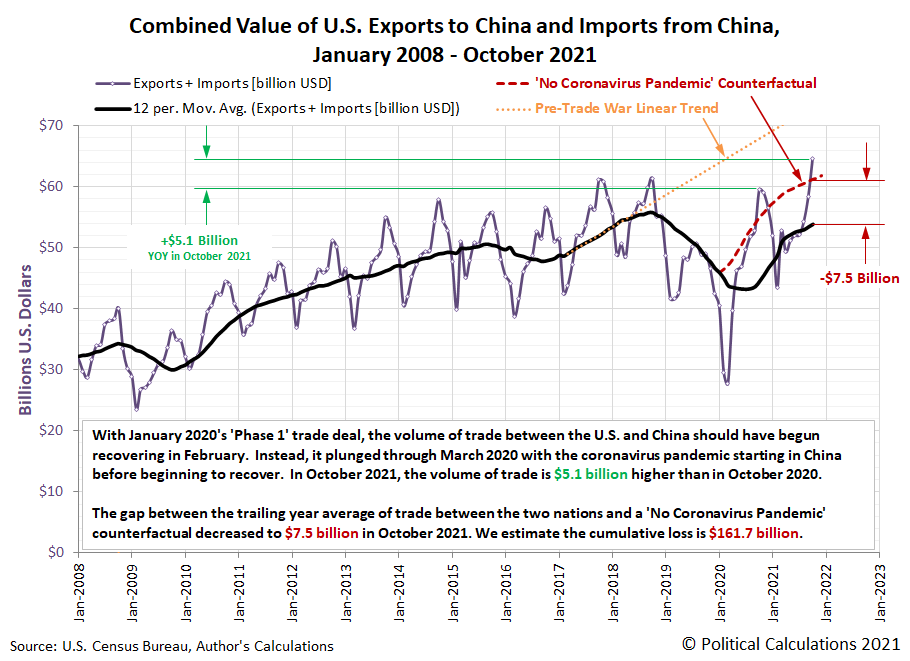
Ironman notes that while dollar amounts of trade are up, "...the quantity of goods traded between the U.S. and China is lower than indicated by their value" due to inflation.
With all eyes on the upcoming Federal Open Market Committee (FOMC) meeting, TM contributor Bob Lang checks in on The Fed And The Markets: What Will Happen Next?. For starters Lang reminds us that:
"The Fed has one permanent instrument and one temporary tool. The temporary tool is the easiest one to implement, and it’s already been announced: Taper the emergency bond buying program. The bond-buying will probably end by the close of Q2 in 2022. The permanent tool is a bit trickier, and this is what’s bothering the markets. The tool is rate hikes, and the markets want to know when they’ll happen."

Lang writes that, "The committee is fretting about the pressure of unrelenting inflation on the economy. The supply chain remains clogged, causing product shortages amid strong demand and sharp increases in labor costs...and...Markets are trying to figure out if the Fed will hike interest rates two or three times in 2022..."
And as for Chairman Powell's press conference on Wednesday, "Economic projections are likely to be all over the map from the committee, hence rising uncertainty over policy decisions. That uncertainty may stoke a bit of fear in the markets...thus, "The dance between the Fed and the markets continues."
Bitcoin (BITCOMP) has been volatile and no less so, Ethereum (ETH-X). Contributor Tyler Bundy gives TalkMarkets readers the rundown in his article, Ethereum Drops Below A Key Level: What You Need To Know.
"Ethereum looks to have broken back below the $4,000 level where it has found resistance in the past. This is a sign for traders to be wary in the future as the price could make a large movement downward if unable to hold above this trendline. Ethereum was down 10.16% at $3,739.15 at publication Monday afternoon."
(At 6:58 am Eastern time)
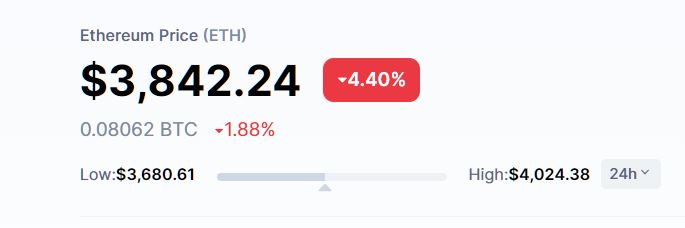
Chart: CoinMarketCap
"Ethereum looked to have broken out of the ascending triangle pattern it was in and was consolidating before the break back below the $4,000 level. This hints the crypto could see a breakdown in the future if unable to recover. The crypto trades below the 50-day moving average but above the 200-day moving average. This shows the crypto looks to be in a period of consolidation and the 50-day moving average may act as resistance, while the 200-day moving average may hold as support. The Relative Strength Index (RSI) has been slowly pushing lower throughout the past couple of weeks and sits at 38. This shows that there are slightly more sellers in the market than there are buyers."
"Ethereum fell below the $4,000 level and now is in an area of uncertainty. If the crypto holds below this level and it begins to act as resistance, then the price may fall back toward the higher low trendline where support has been found in the past."
With many pundits saying that inflation is here to stay, TalkMarkets contributor Sweta Killa finds 5 ETFs Benefiting From High Inflation.

"The pandemic-related supply shortages and continued strength in consumer demand continued to push the prices higher. The so-called core inflation, which strips out volatile components such as food and energy prices, rose 4.9% year-over-year in November — the steepest increase since 1991.
Energy costs jumped a whopping 33.3% from the year-ago levels, with gasoline soaring nearly 58.1%. Food prices climbed 6.1%, while used car and truck prices — a major component of the inflation increase — are up 31%.
The trend is likely to continue in the coming months given surging demand and limited supply."

"Investors could make some profits by investing in ETFs benefiting from rising inflation. These ETFs — Invesco DWA Basic Materials Momentum ETF (PYZ), iShares U.S. Home Construction ETF (ITB), SPDR S&P Regional Banking ETF (KRE), Vanguard Energy ETF (VDE), and Invesco DB Commodity Index Tracking Fund (DBC) — from different corners of the space could be compelling choices for investors amid the growing inflation."
See the full article for more details.
As always, caveat emptor.
Have a good week. I'll see you on the other side of Fed Chairman Powell's press conference.


