
Trick Or Treat Markets

In last week’s missive, I discussed the “seemingly impervious advance” being driven by the advancement towards “tax reform and tax cuts.”
“The last leg higher has been directly responsive to the ramp up in the political “marketing surge” surrounding “tax cuts and tax reform.” With the House having already passed their respective budget resolutions, late Thursday, the Senate passed a budget blueprint for the next fiscal year. With both of the “budget resolutions” in place, it was seen as clearing a hurdle to the goal of overhauling the tax code.
This is not new, of course, as the entire rally for the markets since the election has been driven by hopes of lower taxes, despite disaster, floods, fires and Central Bank threats of liquidity extraction.”
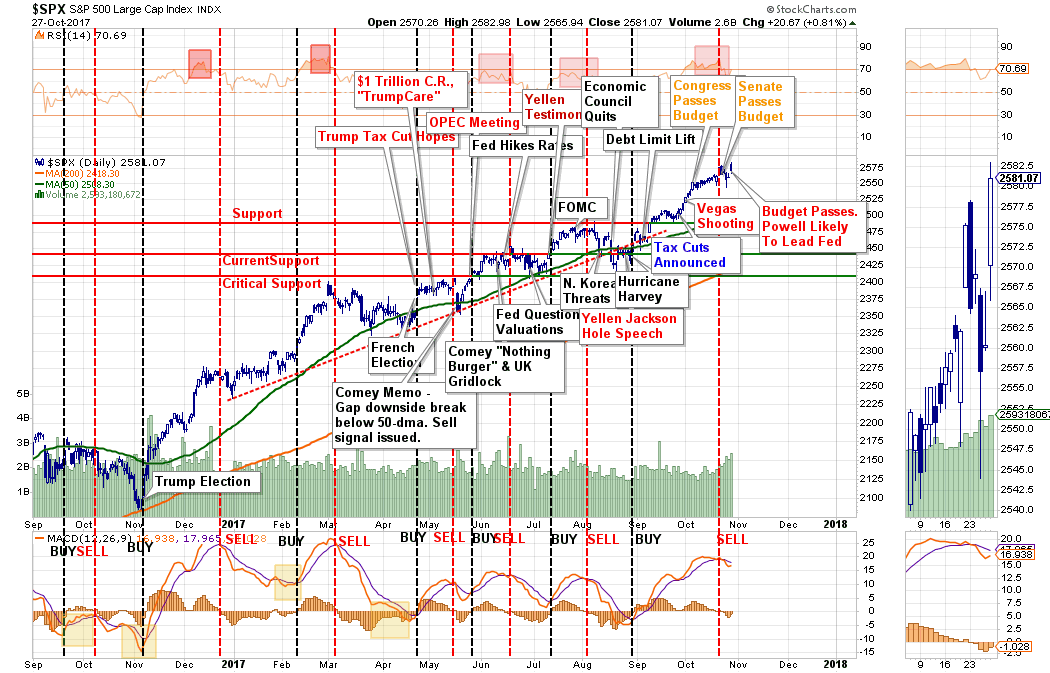
The passage of the budget by the House Of Representatives this past Thursday clears the deck for the advancement of tax cuts and reform. While getting a bill written will be difficult, there is a high degree of motivation to get the bill passed by Christmas especially with 50 Republicans up for re-election next November.
Or, it could be the next Fed Chairman as my partner, Michael Lebowitz, discusses below.
Or, you can just say it was earnings driven.
Whatever reason you want to subscribe to the advance this past week is fine. The reality is the bulls are clearly in charge which keeps us allocated to towards equity risk currently.
It is worth noting, that just as we saw during the run-up in the markets in 2014 and into 2015, the participation rate, as measured by the number of stocks trading above their respective 50 and 200 day moving averages, were declining which signaled a deterioration in participation. That deterioration eventually led to the decline in late 2015 and early 2016.
Currently, even as the market has made a seemingly unstoppable advance this year, the breadth of the advance has once again narrowed markedly.

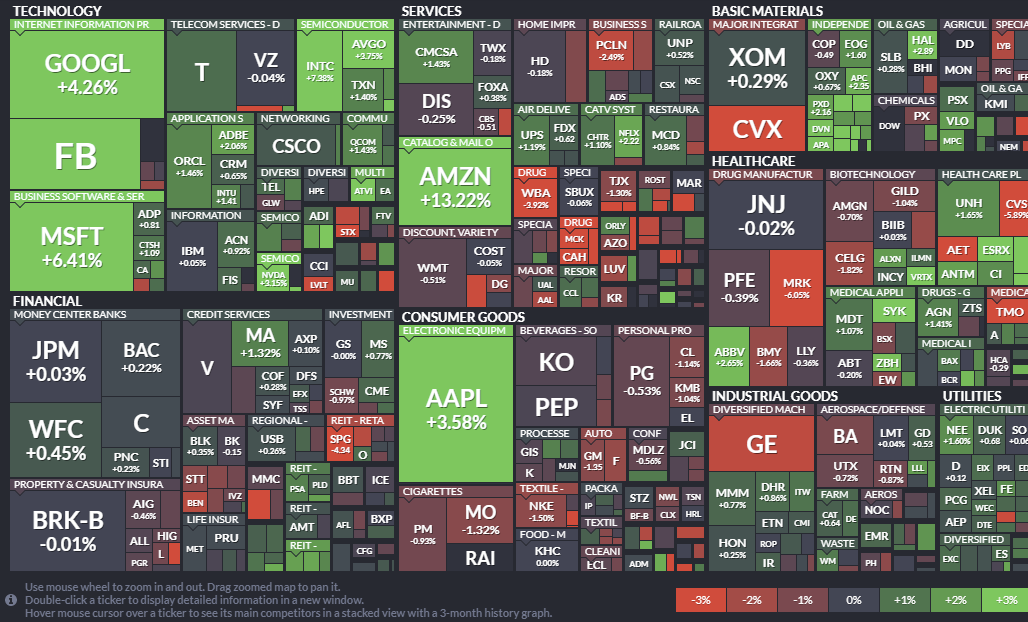
This was clearly noticeable on Friday as the 5-largest technology stocks. by market cap. were the primary contributors to the advance.
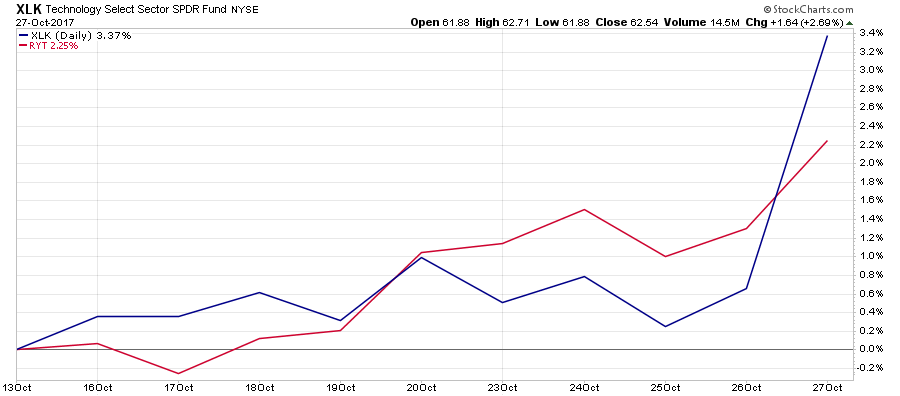
You can see this more clearly here by looking at the difference between the Technology Sector XLK (market-cap weighted) and RYT (equal-weight).
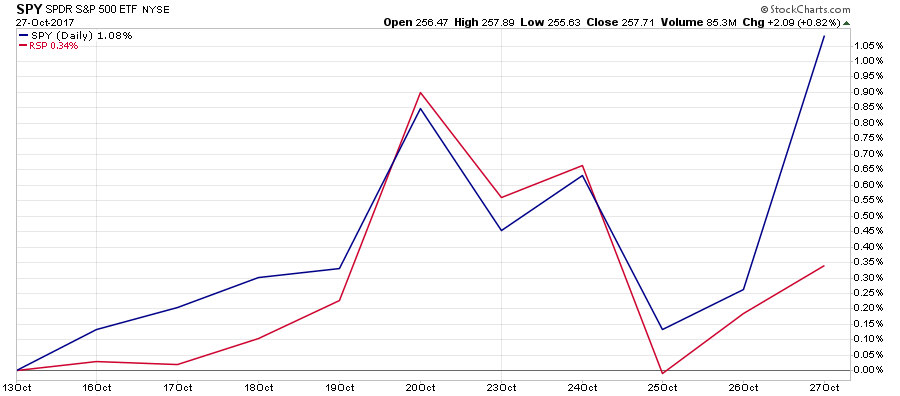
Not surprisingly, since Technology makes up near 1/4th of the S&P 500 index, the surge in the five major Technology stocks magnified the performance of the S&P 500 Index ETF SPY (market-cap weighted) versus RSP (equal-weighting).
With earnings growth very weak for the overall S&P 500 index so far this quarter, the markets well ahead of fundamentals, as I discussed on Tuesday, it just makes sense to remain a bit more cautious currently particularly as the Fed begins to try an “reverse course” on monetary policy.
That doesn’t mean “sell everything” and hide in cash.
It does mean taking some time to review and understand the type and amount of risk you have undertaken in your portfolio and make some adjustments by rebalancing.
We have had one of the longest stretches in history without a 3% correction. That statistic alone suggests we are closer to one than not as “all things must end.” However, given the length of time we have gone without a correction also suggests the next correction will be both larger, and more painful, than currently anticipated.
Taking some actions today will ensure that you don’t make poor, emotionally driven, investment decisions in the middle of that correction that exacerbates the effects of a correction.
Trick Or Treat?
by Michael Lebowitz, CFA
Halloween is around the corner, and in celebration of the season, we thought we would provide you with tricks and treats that the markets might be handing out in the coming months. We also have an idea for someone looking for a one-of-a-kind costume.
Trick: Taper
The Federal Reserve has been treating the market with record amounts of liquidity for the last ten years. As Lance Roberts mentioned in his recent report, The Fed Balance Sheet Unwind Myth, the Fed has begun to reduce the size of its balance sheet (aka taper) and slowly take those treats back from the market. Whether the market initially ignores the Fed’s actions is anyone’s guess, however, over time the drawdown of liquidity will become a bigger impediment to future gains and likely a tail-wind for the inevitable reversion back to normal valuations.
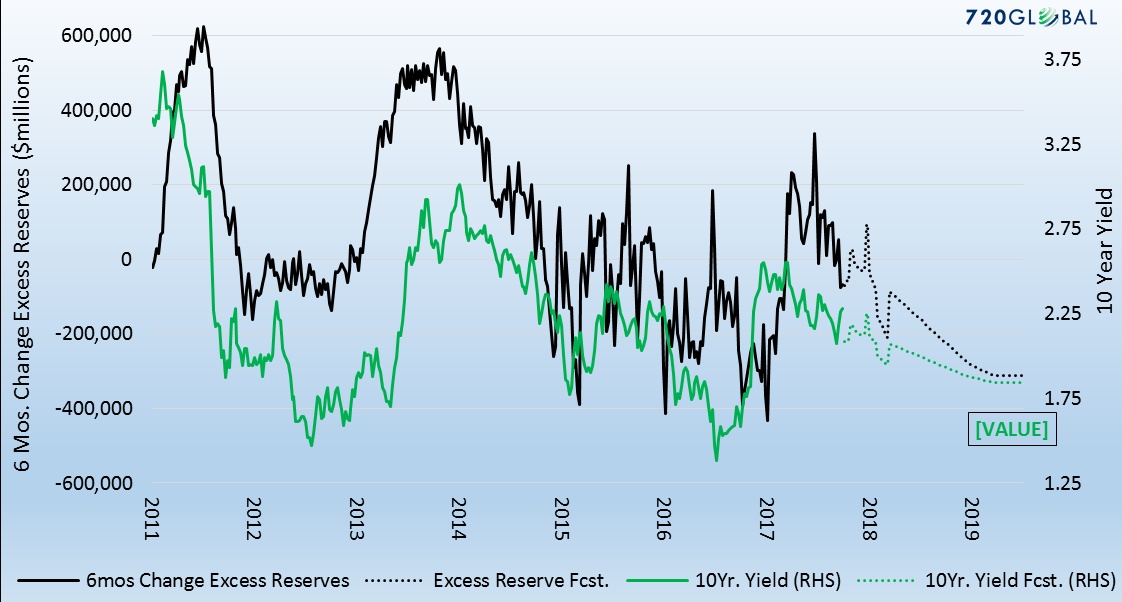
In Lance’s report, he also stated “the Bond Bull ain’t dead… It’s just resting”. To further his thoughts, the following chart plots excess reserves (black), a direct byproduct of QE and Ten-year Treasury yields (green). Based on the Fed’s taper plans we also plotted expected changes in excess reserves (black dotted line) and how those changes might affect Treasury yields (green dotted line).
From my latest subscription only article “Draining the Punchbowl”:
“While one might assume that a reduction in the Fed’s balance sheet and the resulting increased supply of bonds might be bearish for bonds, there are bullish considerations. They are as follows:
- If the Fed reduces the money supply, the dollar might appreciate, import prices would fall and inflation prospects would weaken.
- An appreciating dollar tightens global financial conditions, stresses economic activity and lowers economic growth prospects.
- As banks reduce reserves, they will need to increase capital and purchase U.S. Treasury securities.
- If weakness of stock prices ensues, one should expect investors to seek the safety of the bond market in order to reduce risk.”
Treat: Employment
Next Friday the Bureau of Labor Statistics (BLS) will release the vaunted employment report for October.Last month was a ghoulish report, posting a 33,000 decline in payrolls. Little attention was paid to the data as distortion from Hurricane Harvey was largely to blame. Since that report, there are encouraging signs that employment data has normalized and possibly further strengthened. The most recent weekly jobless claims data has declined to levels last seen in the 1970’s. Current consensus expectations are for a sharp rebound of 310,000 new jobs in Friday’s report.
Trick: Earnings
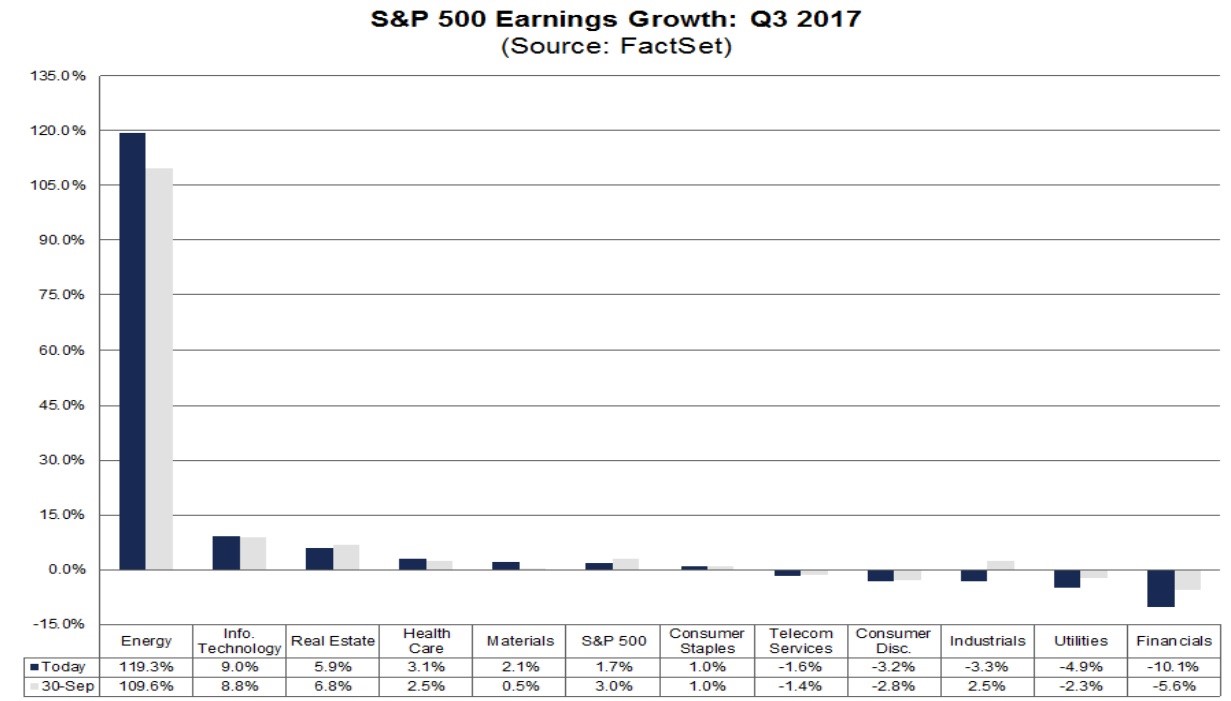
As shown in the graph below, third quarter S&P 500 earnings are expected to increase at a 1.7% rate, down from the 3.0% rate expected only three weeks ago (circled below). More concerning, however, is that the energy sector, despite its small weighting in the S&P 500 contributed significant earnings growth to the entire S&P 500. Without the 119.3% growth from the energy industry, S&P earnings would be down 0.2%. It is important to realize that energy earnings are not a boom per se but a one-off rebound from horrific earnings of 2016. Such earnings growth will not be repeated.
Trick or Treat: Taylor or Powell?
On Thursday the media reported that Donald Trump’s choice for Chairman of the Federal Reserve has been narrowed down to Stanford economist John Taylor and current Fed governor Jerome Powell. Interestingly, the finalists represent both sides of the policy spectrum. Taylor has been vocal that interest rates should be raised. In fact, based on his famous Taylor Rule, the Fed Funds rate should be 3.75%, roughly 2.50% higher than current levels. Powell on the hand takes a dovish posture, similar to that of Janet Yellen. Based on his remarks we might see further rate increases but at a very modest pace and likely pauses or even rate decreases if economic data suffers. A Powell selection is likely more bullish for stocks and bonds as the abundant liquidity provided by the Fed will be around longer than what might occur under a Taylor led Fed.
Unique Costume this Halloween: Bear Outfits
Our friend Willie Delwiche, (Investment Strategist at Baird @williedelwiche) shared a graph on Twitter that helps put the current level of stock market complacency in proper context.
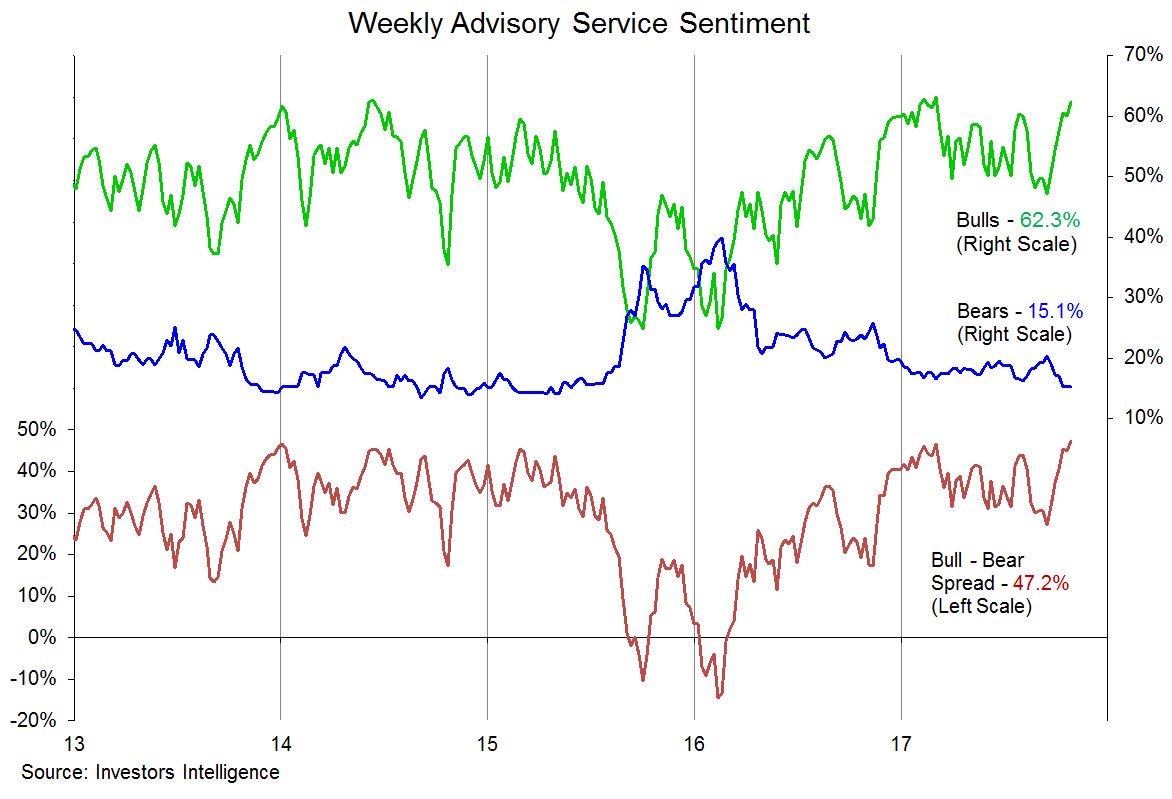
The graph above measures investor sentiment for the last five years. Investors Intelligence surveys equity investors to track the number of people that consider themselves bullish or bearish. Currently, the gap between bulls and the bears stands at not only the highest level since 2013 as shown but the highest level going back to at least 1987. Interestingly, at this juncture of record bullishness, there are even less confessed bears than in 2007 or 1999, the periods just before market drawdowns of over 50%.
The takeaway: Donald Trump, Brexit, Leicester City Football Club, and the New England Patriots have taught us a valuable lesson:
“When no one expects the unexpected, expect it.”
Market & Sector Analysis
Data Analysis Of The Market & Sectors For Traders
S&P 500 Tear Sheet

Performance Analysis
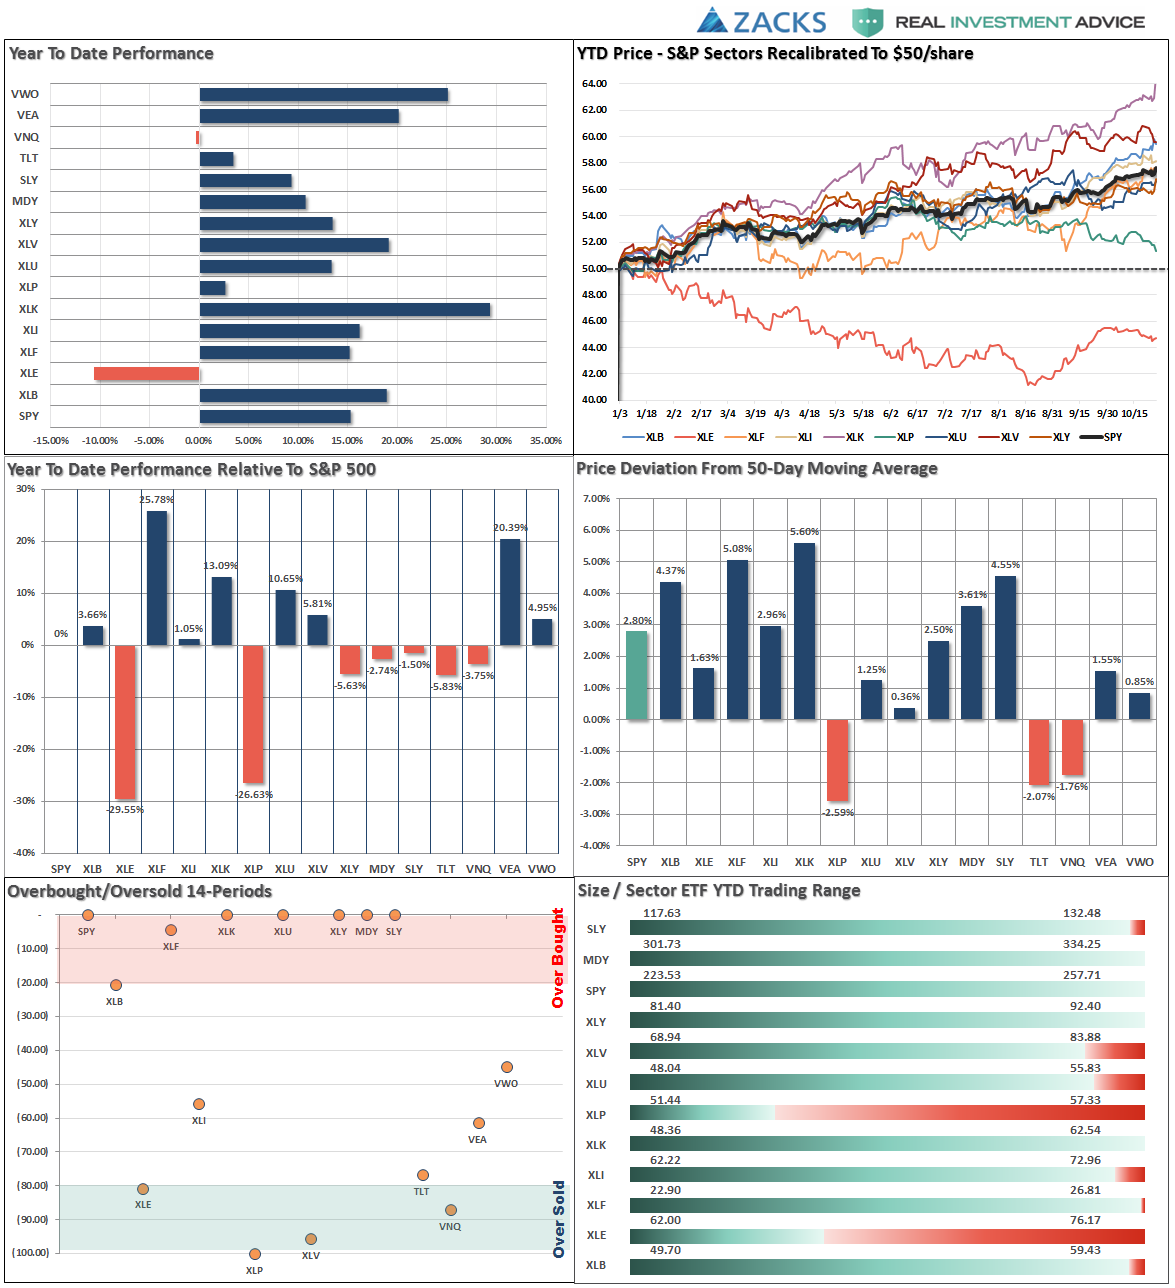
ETF Model Relative Performance Analysis
Sector & Market Analysis:
This past week, the bull market continued its advance, although a bit more wobbly as volatility picked up last week. With bullish sentiment still pushing extremes, there seems to be little of concern of investment risks currently as the year-end approaches and the “seasonally strong” period of the year goes into full swing.
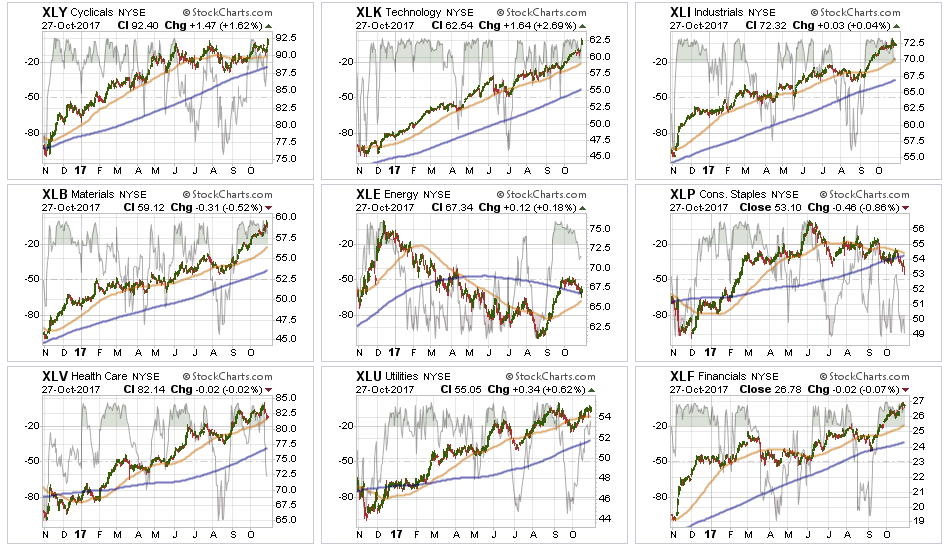
Technology and Discretionary – surged higher on Friday as money chased the few stocks that grossly overweight these sectors (FB, AMZN, GOOG, MSFT) as noted above. However, despite the relatively narrow lead, the sectors did push to new highs keeping money allocated accordingly. However, some profit taking is warranted to rebalance risk.
Staples reiterating last week’s comment:
“Staples are showing significant weakness. Reduce exposure with the break of the 200-dma for now.”
Basic Materials, Financials, and Industrials stagnated last week but remain exceedingly overbought with valuations stretched. Rebalance risks and allocations accordingly.
Healthcare has slipped back to its 50-day moving average an bounced off that support on Friday. The trend remains positive currently, but watch for a violation of the support to signal a potential shift in portfolio weightings. Move stops up to the September lows for now.
Energy as I noted last week:
“While the underlying technicals are beginning to improve, the sector must stay above the 200-dma while working off the extremely overbought condition that currently exists.”
On Friday, the sector bounced off of the 200-dma as oil prices finally broke above $52/bbl. With the 50-dma now having turned back up, and approaching a cross of the 200-dma, we are becoming much more interested in adding energy back into portfolios after having been out of the sector since 2014.
Utilities, we remain long the sector and have moved stops up to the 50-dma. Trends remain positive and interest rates have likely peaked for the current advance.
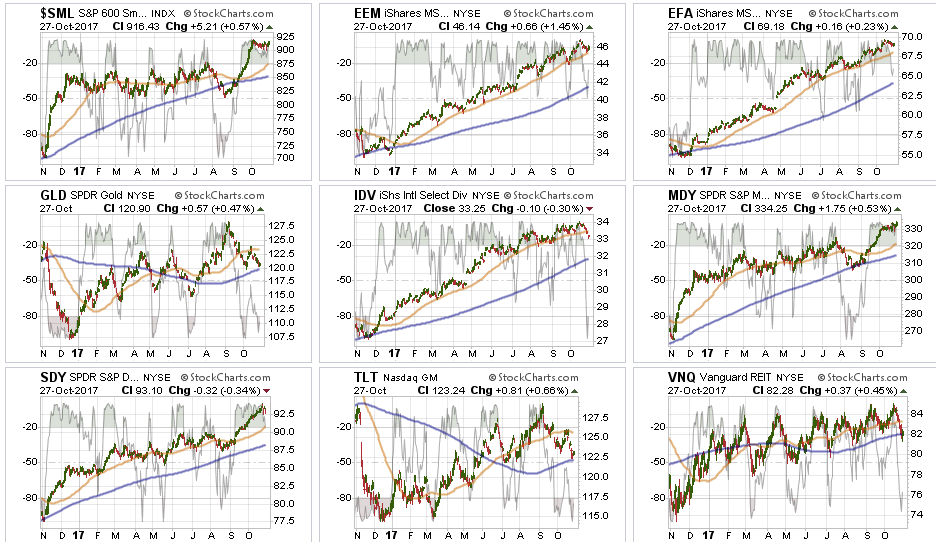
Small and Mid-Cap stocks have stalled over the last couple of weeks and remain extremely overbought. Stops should be moved up accordingly. We previously took some gains out of these sectors but remain long for now.
Emerging Markets and International Stocks have shown some weakness as of late but remain in a bullish trend overall. We remain long these markets for now but have moved up stops accordingly.
Gold – I noted previously the failure of precious metals to break back above the 50-dma. With the complete absence of FEAR of a potential crash, gold has temporarily “lost its luster” as a safe haven. We continue to watch the commodity currently, but remain on the sidelines for now.
S&P Dividend Stocks, after adding some additional exposure recently the index managed an extremely strong advance which ended last week as market participation narrowed sharply. We are holding our positions for now with stops moved up to $92. Take some profits and rebalance accordingly. Dividend stocks have gotten WAY ahead of themselves currently as the yield chase continues.
Bonds and REIT’s took a hit this week as “tax reform” moved forward and the expectations for higher inflation, wages, and economic growth pushed rates higher. While the economic benefit from tax reform is “WAY OVERSTATED,” we will continue to add more exposure if rates push towards 2.5-2.6% which is our target for this reversal.Both of these sectors are VERY oversold.
Sector Recommendations:
The table below shows thoughts on specific actions related to the current market environment.
(These are not recommendations or solicitations to take any action. This is for informational purposes only related to market extremes and contrarian positioning within portfolios. Use at your own risk and peril.)

Portfolio Update:
No changes this past week.
We used the pop in interest rates to move cash management accounts, and larger cash holdings, into our cash allocation strategy providing for better yields. We also added some new bond exposure to accounts and are looking for additional opportunities if rates push higher over the next couple of weeks. As noted our target for the current advance, based on tax reform “hopes,” is the 2.5-2.6% range.
We remain extremely vigilant of the risk that we are undertaking by chasing markets at such extended levels, but our job is to make money as opportunities present themselves. Importantly, each week we raise trailing stop levels and continue to look for ways to “de-risk” portfolios at this late stage of a bull market advance.
As always, we remain invested but are becoming highly concerned about the underlying risk. Our main goal remains capital preservation.
THE REAL 401k PLAN MANAGER
The Real 401k Plan Manager – A Conservative Strategy For Long-Term Investors
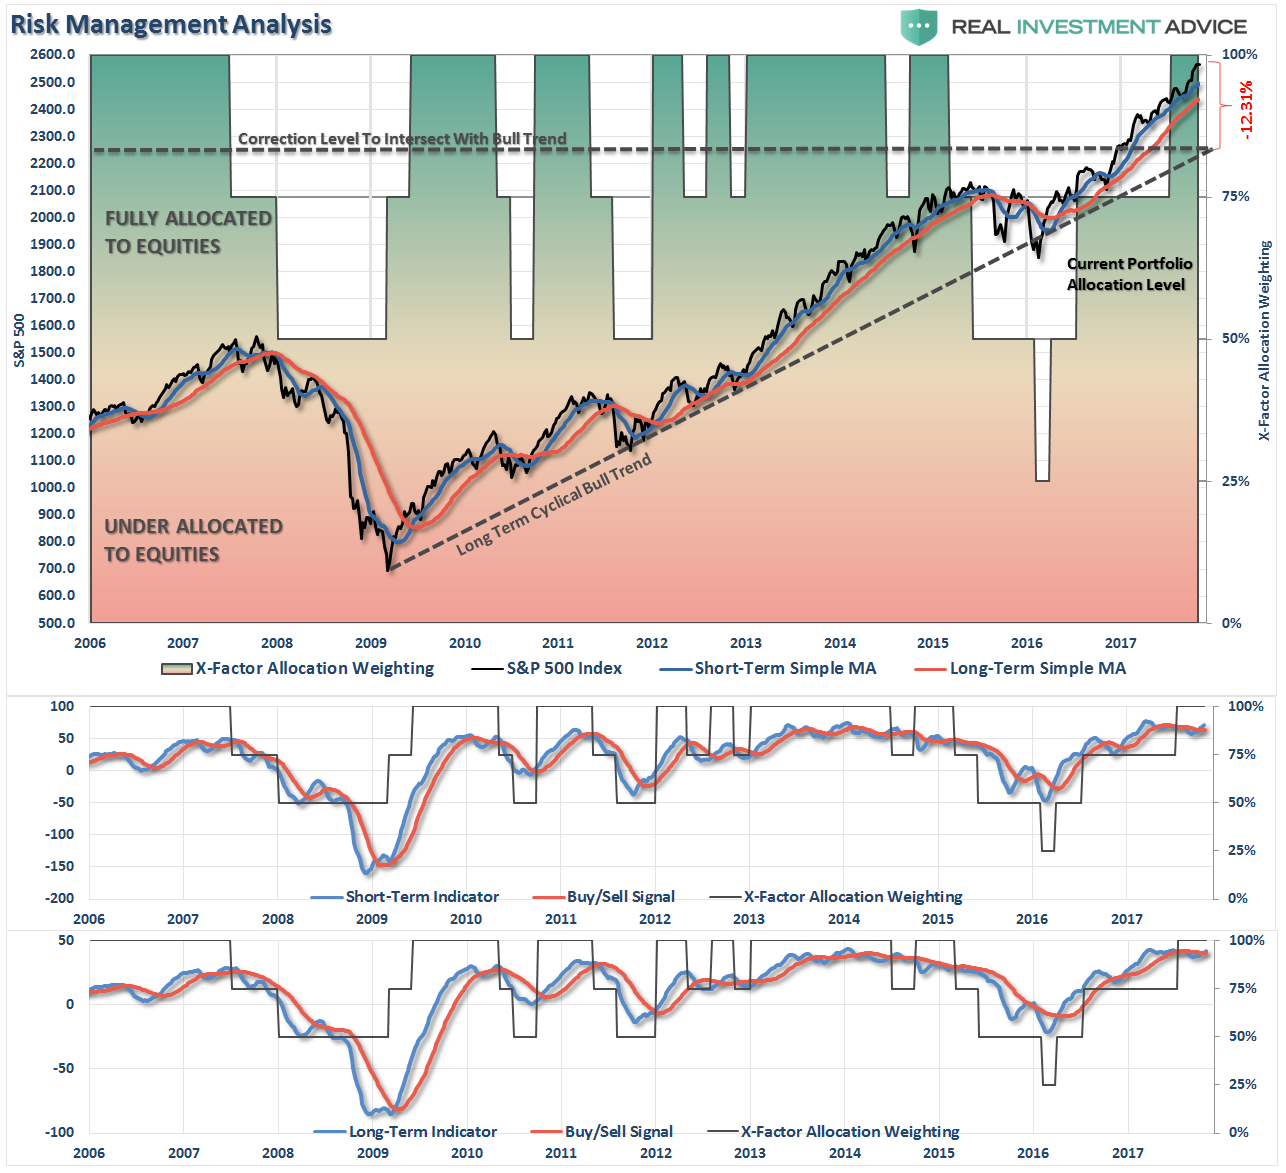
There are 4-steps to allocation changes based on 25% reduction increments. As noted in the chart above a 100% allocation level is equal to 60% stocks. I never advocate being 100% out of the market as it is far too difficult to reverse course when the market changes from a negative to a positive trend. Emotions keep us from taking the correct action.

Tech SuperCharge
Bullish trends remain decidedly bullish which keeps portfolio allocations at target levels for now.
Furthermore, the markets continue to push extremes on all fronts and, as noted in the chart above, it would require a near 13% decline just to intersect with the support and the long-term bullish trend. Extreme deviations from long-term trends don’t last forever, so caution is advised with overly aggressive exposure.
Over the last several weeks, I suggested taking the recent advance as an opportunity to rebalance risks in portfolios by trimming overweight equity exposure and adding to fixed income exposure.
With those actions complete, there is nothing to do currently except wait for the next signal to take action.
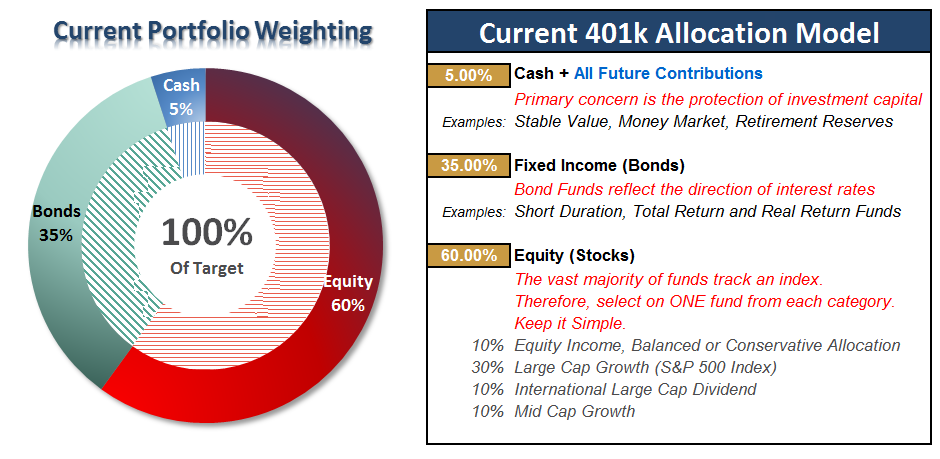
All NEW contributions to plans should currently be adjusted to cash or cash equivalents like a stable value fund, short-duration bond fund or retirement reserves. Stop loss levels should be moved up accordingly.
Current 401-k Allocation Model
The 401k plan allocation plan below follows the K.I.S.S. principle. By keeping the allocation extremely simplified it allows for better control of the allocation and a closer tracking to the benchmark objective over time. (If you want to make it more complicated you can, however, statistics show that simply adding more funds does not increase performance to any great degree.)
401k Choice Matching List
The list below shows sample 401k plan funds for each major category. In reality, the majority of funds all track their indices fairly closely. Therefore, if you don’t see your exact fund listed, look for a fund that is similar in nature.

Disclosure: The information contained in this article should not be construed as financial or investment advice on any subject matter. Streettalk Advisors, LLC expressly disclaims all liability in ...
more

