
Top 7 Contenders In The U.S. Marijuana Market
This week the cover story in Barron’s analyzed and opined about a specific subset of the hot marijuana industry.
As a result, I’ve found a few stocks you may want to keep your eye on for big trend trades. Here’s how I found them.
One of my favorite ways of finding ideas for big trend trades is to let someone else do the fundamental research, and for 30- years Barron’s has been one of the best sources for ideas, market insight, and continuing education.
When I like the story or the fundamental analysis presented by Barron’s, then I’ll identify the time to enter a trade with our MarketGauge indicators such as our Triple Play analysis.
This week’s Barron’s was a perfect example of this with some very interesting stocks, so I decided to share them with you here.
I Didn’t Come to This Party Party Early, but I Don’t Think I’m Late
Thanks to Michele’s early focus on the marijuana trend as one of her Mega-Trends, I’ve become increasingly interested in the trading opportunities in the sector.
After dismissing this sector for too long, the marijuana industry is more than just an interest for me now. I currently hold positions in four companies in or related to this industry: CGC, TLRY, NBEV, and PYX. These positions range from long-term plays, to options trades (up over 600%) nearing completion, and short-term swing trades.
Please do not interpret my disclosure of current positions as any indication that they are timely candidates for new trades.
Prior to reading this week’s Barron’s article, I did not have any of the 7 stocks covered in the article on my “Pot watchlist” from which I look for new trades.
So I was thrilled to find these 7 new names to add to my watch list and gain a basic understanding of what they do from Barron’s.
Even better, as I said above, I was able to pick out my favorites from the article and then apply our Triple Play indicators to them to figure out if there were any timely trades in the list.
The focus of the article is on companies that are selling marijuana products in the U.S. and are listed on U.S. stock exchanges. If you’re interested in this industry, I highly recommend reading the article.
A Perfect Place To Find A Big Idea
It isn’t hard to guess the author’s bias with a coverline of “You’ve Got to Be High to Buy U.S. Marijuana Stocks”, followed by this short summary…
“A half-dozen companies are vying for leading roles in what bulls believe could be a $50 billion business. But it’s too early and the outlook is too uncertain to pick winners”
THAT SOUNDS LIKE A PERFECT PLACE to be looking for the next big trend trade with our own tactics!
As you might expect, Barron’s focused on areas such as valuation, profitability, the supply of shares held by insiders, and more. I’ll leave most of that to Barron’s.
What The Charts & Triple Play Indicators Say
Below you’ll find charts of the 7 stocks with our Triple Play “Price Performance” and “Volume Performance” indicators.
Since not every reader will have access to our Triple Play indicators I’ll explain the basic analysis of the indicators first using the popular marijuana sector ETF, ETMG Alternative Harvest (MJ).
None of the stocks mentioned below are in the top 10 holdings of MJ, and may not be in it at all. However, it does represent a way to see the trend of the sector.
Each chart is formatted the same with the top section being a daily candlestick chart with 10, 50 and 200-day moving averages when there has been enough trading since the stock’s IPO.
(Click on image to enlarge)

Below the candlestick chart, there is a Triple Play “Price Performance” indicator and “Volume Performance” indicator.
Price Performance measures the strength and trend of a stock’s leadership quality. It answers the question of whether or not a stock has trend strength that is unusually strong or weak.
A stock or ETF’s leadership trend provides a good indication of whether or not it will hold conventional support levels (price based or moving averages) when it pulls back.
Likewise, leadership is a good indicator for identifying trends that will persist.
The bottom indicator, Volume Performance, measures the trend in volume. The implications of this indicator are the same as the Price Performance indicator. However, it’s measuring volume rather than price action.
Conveniently, both the Price Performance and Volume Performance indicators can be read the same way. The blue line is a short-term measure, and the red line is an intermediate-term measure.
When the blue line is over the red line, it is bullish, and when it’s under the red line it’s bearish.
Looking at the MJ chart above, you’ll notice that when MJ’s price moved up in August of 2018 this move coincided with both Triple Play Price and volume indicators turning positive.
At the highs in October, both indicators (volume first) broke down before or with a price.
The Triple Play indicators stayed bearish and so did the market, until late December or early January.
In January, when the price rallied to the 200-day moving average, both Triple Play Price Performance and Volume Performance were bullish suggesting that the uptrend would break the 200-day average. And it did.
The chart currently suggests that the uptrend will continue.
I’ll begin looking at the stocks whose stories I prefer first.
Typically, I don’t need a company to be profitable to believe in its long-term prospects, but as in this industry, I do believe that erroring on the side of profitable vs. deficit spending to grow makes sense.
Therefore, the first two are the only ones that are profitable – Harvest Health & Recreation (HRVSF), and Trulieve Cannabis (TCNNF).
Harvest Health & Recreation (HRVSF)
From a price action perspective Harvest Health & Recreation (HRVSF), below, looks the strongest of the group because it’s at all-time highs.

Its Triple Play indicators confirm its price strength, but I don’t see a good reward to risk entry until it pulls back into the $6-$7 range. At that point, we’ll have to make sure that Triple Play is still positive.
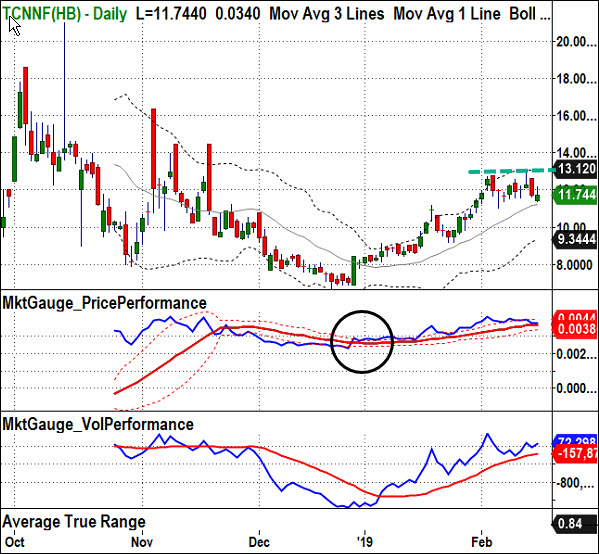
Trulieve Cannabis (TCNNF)
TCNNF, below, is of interest because it is profitable. However, it is currently stalled around the high of its IPO day’s high. This would be a logical place for it to fall from, so I’d wait for positive price action.
Triple Play price and volume have remained bullish since turning bullish near its December lows, so if this breaks out over the recent consolidation, I’ll like it.
(Click on image to enlarge)
Green Thumb Industries (GTBIF)
GTBIF has a net income loss, but it is profitable on an Ebitda basis, and it has publicly traded track record that allows us to see a real trend.
Furthermore, its trend exemplifies a series of Triple Play patterns.
(Click on image to enlarge)

First, the December candlestick chart low created a divergent low with the Triple Play Price Performance indicator as indicated by the dotted lines on the chart.
Second, the January rally was confirmed by both price and volume indicators.
Third, the “squeeze” labeled on the charts is a Bollinger Band pattern that we leverage with Triple Play. A breakout of a squeeze that includes a Triple Play Price & Volume confirmation can lead to a big move.
If the current pullback (and Inside Day Pattern for all you Slingshot Trading members) resolves to the upside, this would be my favorite trade of this post.
My stop will be under $12.
Acreage Holdings (ACRGF)
The next stock is one that I thought would be my favorite because of this interesting fact that Barron’s brought to my attention…
What do these three public figures all have in common?
- John Boehner, former Speaker of the House of Representatives
- Bill Weld, former Governor of Massachusetts, and potential presidential candidate.
- Brian Mulroney, former Tory Prime Minister of Canada.
They are all on the advisory board of New York-based Acreage Holdings (ACRGF), and according to George Allen, Acreage President, “They are very valuable in helping us get problems solved.”
All political opinions aside, that’s a very believable statement, and…
I have to admit, in this industry, I think Mr. Allen has a very good strategy politically.
While ACRGF didn’t post a profit, their loss of $2 million on $54 million in revenues, with $74 million in cash doesn’t represent a serious concern.
I thought I’d find the same level of interest in the stock's chart.
But I don’t see it.
(Click on image to enlarge)

The IPO day’s range is important to me.
It’s back there now, and weak by Triple Play measures (blue lines under the red lines)
So until it shows positive Triple Play Price Performance and Volume Performance measures, and trades over the resistance at $24, I’ll just keep an eye on it.
The stocks story sounds good, but it’s hard to know what I really driving the price of a stock!
This is why I pay close attention to the Triple Play Price Performance indicator.
When the indicator bullish it means there is demand for the stock over and above the general trend in the markets.
iAnthus Capital Holdings (ITHUF).
ITHUF posted a $55 million net income loss on revenues of only $39 million, and with only $38 cash on the books.
That doesn’t sound good, yet its stock looks bullish.
(Click on image to enlarge)

As you can see, the Triple Play Price and Volume performance indicators suggested that its 200-day MA would breakout as it did and now everything on the chart is pointing higher.
I prefer stocks that have obviously bullish fundamental stories when I’m looking at Barron’s because that’s I’m fishing in Barron’s for, but this looks like a break over Friday’s high will continue higher.
Curaleaf Holdings (CURLF)
CURLF has had bullish Triple Play indicators all year, and this would have been a good reason to expect the breakout over the consolidation between $6.35-$6.45 to work as it has.
(Click on image to enlarge)

However, now at $7.50, I don’t see a good set up. I’ll wait to see what it looks like if it closes over $8.50 or pulls back to around $7.
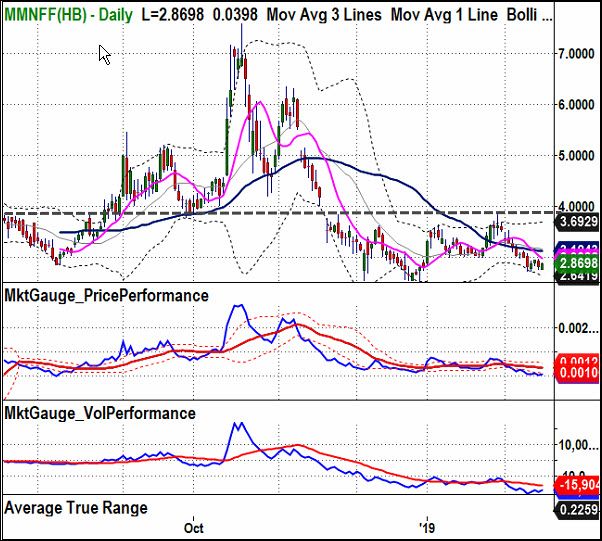
MedMen Enterprises (MMNFF)
MMNFF is the least interesting. Clearly, the Triple Play indicators are negative and the price action of the stock is just consolidating. With plenty of interesting companies and charts in this space, I don’t see any point in following this one until it gets over $4.
(Click on image to enlarge)
If you'd like more information about the additional free trading education mentioned in the video tap ...
more

