
Tilray’s Massive Bull Pennant Chart Pattern: Is The Stock Set To Pop Or Drop?

If you have any experience in Technical Analysis, take one glance at a 1-year candlestick chart of Tilray Inc. (Nasdaq: TLRY) and one aspect of their chart should immediately be apparent to you. You will notice Tilray’s massive Bull Pennant chart formation. It’s HUGE, you can’t miss it.
For those new to Technical Analysis (TA), let’s first establish what a bull pennant is and what it could mean for Tilray’s share price moving forward. As per Investopedia, a bull pennant is a “continuation pattern in technical analysis formed when there is a large movement in a security, known as the flagpole, followed by a consolidation period with converging trend lines – the pennant – followed by a breakout movement in the same direction as the initial large movement.”
Why These Patterns Form
The consolidation period after the breakout that formed the flagpole is caused by a period of indecisiveness in the market. Essentially it’s a battle between the bulls and bears and can last a short amount of time or can drag out for months or even years. A good rule of thumb that is normally accurate is the longer the consolidation period the larger the breakout at the end.
The pennant is formed by the trendlines starting at the top and bottom of the flagpole and extending out to the right while gradually sloping inward toward one another. As the fight between the bulls and bears grows more even the trendlines will eventually meet a point called the “apex”. As the stock approaches the apex of the pennant, volume should begin to pick up as the stock prepares to make its move and breakout.
In these types of patterns, the stock can break out in either direction but in the case of bull pennants, the odds are in favour of the breakout being to the upside. This is due to the stock already being in an uptrend and the bull pennant simply being a break for the stock to reset, work off the last run and continue on its journey higher. Hence the terms “bull pennant” and “continuation pattern”.
Below we are going to cover how to calculate the potential price target of a breakout from a bull pennant pattern. This will help give you an idea of where to set your potential sell orders. It is a good idea to set your sell orders slightly below the calculated price target as well as at an odd number as the majority of traders may have the same idea and the stock could hit a wall before your trade gets filled. Amature traders also tend to set their sells at even numbers which can also cause log jams at certain price levels. Just a couple of tips to help assure you get filled near your target.
Food for Thought
Keep in mind Tilray’s parabolic move this past September was likely influenced by algorithmic trading programs that almost certainly exaggerated the stock’s price to the upside. Tilray also had a smaller float at the time too. This information may or may not play a factor in Tilray reaching its price target on its next breakout.
Either way, this is good information to know and can be applied to any other stock. One note of caution, these patterns may not be as reliable when applied to very low priced penny stocks as toxic debt and aggressive dilution can often counteract the natural flow of the stock.
Moving on, now let’s break down step by step how to calculate the potential price target using Tilray as an example. You can reference the chart below for a visual.
How to Calculate the Potential Price Target of a Bull Pennant Breakout
- Step 1: Calculate the height of the pennant’s flagpole. In TLRY’s case, the flagpole length is roughly $174.71.
- Step 2: Establish the price of the breakout point. This is the point where the stock breaks out above the top descending trendline. In TLRY’s case, the stock has not broken out above the trendline yet so we are going to use $83.70 as our breakout point in this hypothetical example.
- Step 3: Add the length of the flagpole to the point of the breakout. For TLRY we are going to add $174.71 (flagpole) to $83.70 (breakout point).
- Step 4: Calculate your total and establish your potential price target. $174.71 + $83.70 = $258.41 (price target).
As an added layer of protection, you can add a stop loss at a price point just below the bottom trendline so that in the event the bull pennant pattern fails and the price breaks down and reverses, you are covered. No pattern is foolproof regardless of how perfect it may look. Bad news from the company or negative macroeconomic factors can cause any pattern to breakdown and the price to roll over.
Tilray Inc. (NASDAQ: TLRY) 1 Year Chart
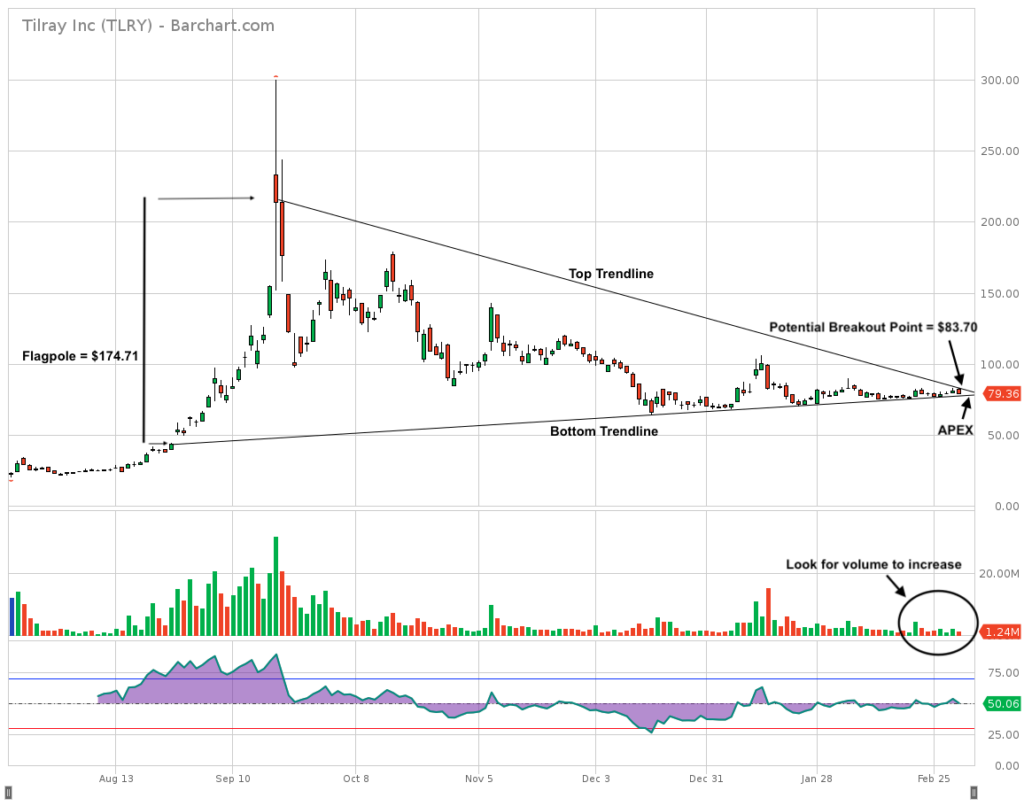
Source: Barchart
Tilray has yet to break out and there can be no assurance that it actually will. We have included a past example below (Marimed -MRMD) which shows in clear detail the pennant formation and the price target being reached with plenty of room to spare. There are many more great examples out there if you take the time to look for them.
Studying these past case studies can make it easier for you to spot these pennant patterns in the future and take action before the stock breaks out. Sometimes you may have to track a stock for a while to allow the pattern to fully develop before making your move. This is where patience comes into play.
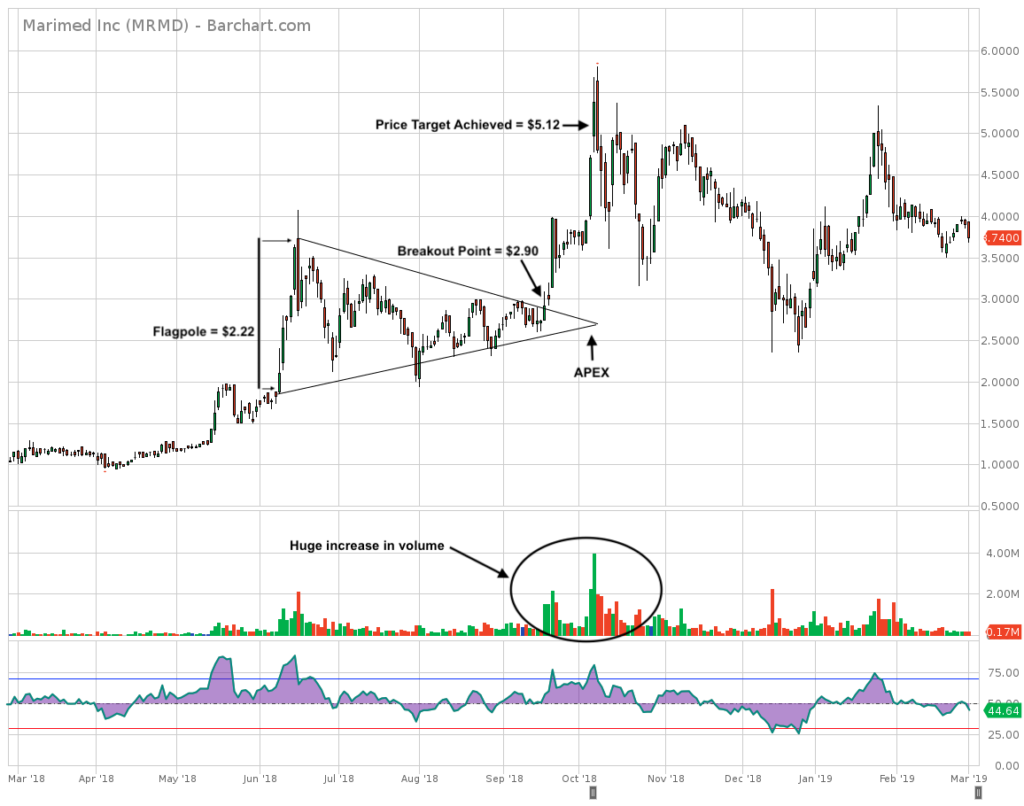
Source: Barchart
Technical analysis can involve a lot of subjective price points and trendlines. Someone else doing the same calculations may come up with slightly different numbers. It is important to remember this fact when implementing these types of calculations into your real life trading strategy.
This is designed to give you a ballpark price target to shoot for which is why I suggested above to slash a little bit off your price target just to be safe and help assure your target is reached. You will normally never nail the perfect top or bottom on any stock trade so the best plan is to try and capture the bulk of the move and make sure you lock in profits when possible.
We hope you learned something new reading this article and become a better trader/investor moving forward. We received great feedback on the RSI article as many people had no clue this little tool existed. Looking back, had they known about the RSI before they might have been able to get out of a position a little earlier and lock in a few extra dollars in profits. Because of this positive feedback, we plan to continue with our technical analysis series.
I have NOT been compensated for this article and hold NO positions in any of the companies mentioned.


