
Three Safe Stocks In A Stormy Market
This week, we’re highlighting three stocks to buy if they get dragged down by the current market turmoil. These stocks are for great companies whose valuations are a little high. If those valuations decline, investors should scoop up these quality businesses. The Home Depot (HD: $227/share), The TJX Companies (TJX: $61/share), and ICON PLC (ICLR: $160/share) are this week’s Long Ideas.
Market Fears Drive Overreactions
The global outbreak of the coronavirus has rattled the market. Investors and analysts alike are concerned about its impact on the global economy. The S&P 500 recently had its worst week since October 2008 while entering correction territory at the fastest rate in history.
World leaders and experts believe the outbreak will get worse, which could lead to further downside in the market. However, it’s not all bad news for investors. Over the long-term, market corrections present great money-making opportunities, as Warren Buffett says “be greedy when others are fearful.”
Focus on ROIC – It Drives Valuations
The winners both during and after a market crash, as we have shown, tend to be companies that earn a high return on invested capital (ROIC). Furthermore, there is a strong correlation between improving ROIC and increasing shareholder value. To that end, we began our search looking for companies with consistently high and/or rising ROICs.
In addition to high ROICs, the firms below have a history of rising core earnings[1],economic earnings. and positive free cash flow. Each of these companies are high-quality, value-creating businesses. However, as Figure 1 shows, their price-to-economic book value (PEBV) ratios show that the market still expects a significant amount of growth from them. PEBV compares the current valuation of a company to its zero-growth value. A PEBV of 1 would mean that the market expects the company’s cash flows to stay flat into perpetuity.
Figure 1: Three Stocks Worth Buying If Prices Correct Further

Sources: New Constructs, LLC and company filings
Our Stock Rating Methodology considers a PEBV below 1.6 but above 1.1 to be “Attractive” and a PEBV below 1.1 but above 0 to be “Very Attractive”. These companies are still less expensive than the S&P 500 (SPY) – with a PEBV of 2.6 – but more expensive than the stocks we typically recommend. If global fears send markets falling further, it could present an opportunity to get these quality businesses without paying a premium.
ICON, PLC (ICLR) – Attractive Rating
ICON, PLC (ICLR) was recently upgraded to Attractive (from Neutral) after we parsed its 2019 20-F (filed on February 27, 2020). We first made ICON a Long Idea in May 2017. Since then, the stock is up 82% while the S&P 500 is up 29%. The company remains a leading contract research organization (CRO) and a drop in price would present a great buying opportunity.
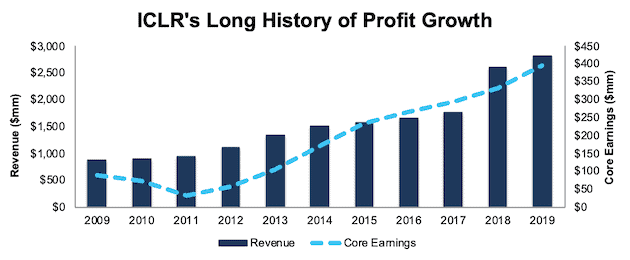
Over the past decade, ICLR has grown revenue by 12% compounded annually and core earnings by 16% compounded annually, per Figure 2. The firm has increased its net operating profit after-tax (NOPAT) margin year-over-year (YoY) in seven of the past 10 years and its 2019 NOPAT margin of 15% is up from 11% in 2009. ICLR has improved its ROIC from 16% in 2009 to a top-quintile 25% in 2019 and has generated $859 million (9% of market cap) in cumulative free cash flow over the past five years.
Figure 2: ICLR’s Revenue & Core Earnings Since 2009
Sources: New Constructs, LLC and company filings
In 2019, ICLR had -$26 million in earnings distortion that caused GAAP earnings to be understated. Notable unusual expenses in ICLR’s 20-F include:
- $31 million in asset write-downs hidden in operating earnings – Page 93
These unusual expenses were partially offset by:
- $2 million in sub-lease income – Page 132
Only by removing these unusual expenses and gains can we evaluate the core earnings of ICLR’s operations. In total, we identified $0.48/share (7% of GAAP EPS) in net unusual expenses in ICLR’s 2019 GAAP results. After removing this earnings distortion, ICLR’s 2019 core earnings of $7.27/share are higher than GAAP EPS of $6.79.
ICLR’s Earnings Distortion Score (as featured on CNBC Squawk Box) is currently “In-Line”, which means we expect it to report in-line with consensus expectations. Our Earnings Distortion Scores provide investors with a short-term look at the likelihood a firm will beat/miss consensus expectations. Longer-term, we focus on our overall Risk/Reward Ratings, which take into account a firm’s historical profitability and the level of expectations baked into the current stock price. As noted above, ICON PLC earns an Attractive Risk/Reward rating, which means it provides quality risk/reward going forward, even if it’s not more likely to beat consensus expectations in the coming quarter.
Economic Earnings Growing Faster Than Core Earnings
Core earnings account for unusual gains and expenses included in GAAP net income. To get the full picture of a company’s operations and hold management accountable for capital allocation, we also analyze balance sheets to calculate an accurate ROIC and economic earnings, the truest drivers of shareholder value.
Some notable adjustments to ICLR’s balance sheet include:
- Removed $514 million in excess cash
- Added $34 million in accumulated asset write-downs
- Removed $17 million in deferred tax assets
After all adjustments, we find that ICLR’s economic earnings grew 20% compounded annually over the past five years and 18% compounded annually over the past decade.
Shares Starting to Look Cheap
At its current price of $160/share, ICLR has a price-to-economic book value (PEBV) ratio of 1.3. A 15% decrease in stock price to ~$136/share would give ICLR a PEBV of 1.1.
The expectations baked into ICLR’s valuation remain low relative to the firm’s historical growth and expected industry growth. To justify its current price of $160/share, ICLR needs to maintain current NOPAT margins (15%) and grow NOPAT by just 6% compounded annually for the next six years. See the math behind this reverse DCF scenario. For reference, ICLR has grown NOPAT by 18% compounded annually over the past five years and 15% compounded annually over the past decade.
Even if we assume ICLR simply maintains margins and grows NOPAT by 7% compounded annually (in-line with projected industry growth) for the next decade, the stock is worth $189/share today – 18% above its current price, with even more upside should a market crash bring ICLR down further. See the math behind this reverse DCF scenario.
Leading Profitability Amongst Competitors
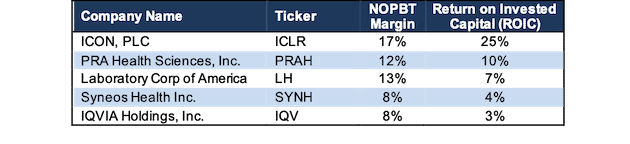
As we pointed out in our original Long Idea, ICLR’s lean cost structure and operational efficiency give it a competitive advantage over peers. Such an advantage is still present today. Per Figure 3, ICLR’s ROIC and net operating profit before-tax (NOPBT) margin rank well above its publicly traded competitors (as listed in the firm’s 20-F). We use NOPBT margin in the below comparison because being domiciled in Ireland provides a unique tax advantage for ICLR.
Figure 3: ICLR’s Profitability Leads Competition
Sources: New Constructs, LLC and company filings
The TJX Companies (TJX) – Attractive Rating
We first featured The TJX Companies (TJX) as a Long Idea in April 2018. Since then, the stock is up 45% while the S&P 500 is up 17%. The company remains a best-in-class off-price retailer that is worth a close look in a market downturn.
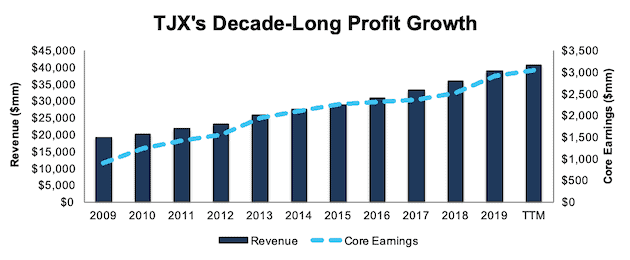
Since 2009, TJX has grown revenue by 7% compounded annually and core earnings by 12% compounded annually, per Figure 4. TTM core earnings are up 5% over fiscal 2019.The firm’s profit growth can be attributed to its rising profitability, as its NOPAT margin has increased from 5.5% in 2009 to 8.2% TTM while its ROIC improved from 12% to 19% over the same time.
Figure 4: TJX’s Revenue & Core Earnings Since 2009
Sources: New Constructs, LLC and company filings
TJX’s Earnings Distortion Score is currently “In-Line”, which means we expect it to report in-line with consensus expectations. As noted above, The TJX Companies earns an Attractive Risk/Reward rating, which means it provides quality risk/reward going forward, even if it’s not more likely to beat consensus expectations in the coming quarter.
Economic Earnings Growing Even Faster
We analyze balance sheets to calculate an accurate ROIC and economic earnings and made the following adjustments to TJX’s balance sheet:
- Added $8.1 billion in operating leases
- Added $637 million in accumulated other comprehensive loss
- Added $324 million in accumulated asset write-downs
After all adjustments, we find that TJX’s economic earnings grew 13% compounded annually over the past decade.
Shares Are Almost a Bargain
At its current price of $61/share, TJX has a price-to-economic book value (PEBV) ratio of 1.4. A 15% decrease in stock price to ~$52/share would give TJX a lower PEBV of 1.2.
At its current valuation, TJX investors benefit from a 1.5% dividend yield and 23 consecutive years of dividend growth. A market correction would make this high-quality company an even better stock.
The expectations baked into TJX remain low relative to the firm’s historical growth and consensus estimates. To justify its current price of $61/share, TJX needs to maintain current NOPAT margins (8%) and grow NOPAT by just 5% compounded annually for the next eight years. See the math behind this reverse DCF scenario. For reference, TJX has grown NOPAT by 7% compounded annually over the past five years and 12% compounded annually over the past decade. This scenario also assumes TJX’s NOPAT margin stagnates after YoY improvement in seven of the past 10 years.
If we assume TJX can improve margins to 9% (from 8% TTM) and grow NOPAT by just 6% compounded annually for the next decade, the stock is worth $70/share today – 15% above its current price, with even more upside should a market crash bring TJX’s price down. See the math behind this reverse DCF scenario.
TJX Bucks the “Retail Apocalypse” Narrative
In a retail environment where the weak are getting increasingly left behind, The TJX Companies has proven its staying power. Apart from the improving profitably noted above, TJX reported fiscal 2019 was its 24th consecutive year in which comparable store sales grew year-over-year. The firm’s ability to grow comparable store sales for over two decades is a testament to TJX’s value proposition to consumers and the ability to efficiently manage its operations.
As Rod Sides, vice chairman of Deloitte, and its U.S. retail and distribution sector leader stated, “off-price stores can help provide price relief during a more challenging economy. But, even in times of economic growth, these stores still do well. For a significant portion of the population, price and value are important from an income standpoint, and off-price is therefore very relevant and successful.”
The TJX Companies has leveraged this success to achieve leading profitability in its industry. Of the 11 Discount Stores under coverage, TJX earns the highest ROIC and NOPAT margin.
Management Now Incentivized to Create Shareholder Value
TJX has achieved its past success despite not properly aligning executives’ interests with shareholders’ interests. Not anymore. Beginning in fiscal 2019, TJX introduced a new executive-compensation plan that seeks to “balance growth, profitability, and returns.”
Under this new plan, TJX added ROIC as a performance modifier to its long-term performance share program, which made up the largest portion of executives’ long-term incentives. ROIC was chosen to reinforce “attention to capital investments and generating returns.”
Going forward, if TJX fails to meet its ROIC performance goals, executives’ long-term performance share awards will be reduced by 20%. While we would recommend TJX use ROIC as more than just a modifier, we still applaud the compensation committee’s decision to hold executives accountable for prudent stewardship of capital. This improved compensation plan, along with TJX’s strong fundamentals earned it a spot in February’s Exec Comp Aligned with ROIC Model Portfolio.
The Home Depot (HD) – Attractive Rating
The Home Depot (HD) was recently upgraded to Attractive (from Neutral) after its stock fell nearly 9% during the recent correction. HD has long been on our radar, but its premium valuation has turned us to cheaper stocks. Further declines in this stock would make us avid buyers.
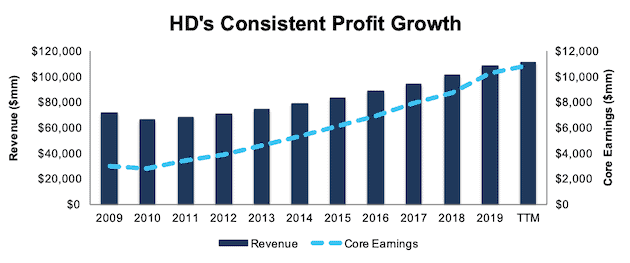
Over the past decade, the company has grown revenue by 4% compounded annually and core earnings by 13% compounded annually, per Figure 5. The firm has increased its NOPAT margin every year since 2009 and its TTM NOPAT margin of 11% is up from 5% in 2009. HD improved its ROIC from 9% in 2009 to a top-quintile 32% TTM and generated $43.5 billion (17% of market cap) in cumulative free cash flow over the past five years.
Figure 5: HD’s Rising Core Earnings Over Past Decade
Sources: New Constructs, LLC and company filings
HD’s Earnings Distortion Score is currently “Miss”, which means we expect it to miss upcoming consensus expectations. However, HD has proven resilient when missing expectations in the past, as investors focus on the long-term profit growth achieved by the firm. HD is up 22% over the past eight quarters (vs. S&P 500 +11%) despite missing revenue expectations in four of the last eight quarters. Looking over the long-term, The Home Depot earns an Attractive Risk/Reward rating, which means it provides quality risk/reward going forward, even if it’s not more likely to beat consensus expectations in the coming quarter.
Economic Earnings Are Growing Too
We made the following adjustments to HD’s balance sheet:
- Added $5.5 billion in operating leases
- Added $1.0 billion in accumulated asset write-downs
- Added $801 million in accumulated other comprehensive loss
After all adjustments, we find that HD’s economic earnings grew 20% compounded annually over the past decade and 16% compounded annually over the past two decades.
Shares Nearing a Buying Opportunity
At its current price of $227/share, HD has a price-to-economic book value (PEBV) ratio of 1.5. A 15% decrease in stock price to ~$193/share would give HD a lower PEBV of 1.3.
Even at its current valuation, HD investors still benefit from a 2.4% dividend yield and seven consecutive years of dividend growth. A market correction would make this high-quality company an even more attractive stock.
Best of all, the expectations baked into HD’s stock price remain conservative. To justify its current price of $227/share, HD needs to maintain current NOPAT margins of 11% and grow NOPAT by 5% compounded annually for the next decade. See the math behind this reverse DCF scenario. This scenario implies HD will grow NOPAT at a compound annual growth rate that is less than half its NOPAT CAGR over the past five, ten, and 20-year periods. Furthermore, it assumes HD’s NOPAT margin remains flat after 10 straight years of YoY improvement.
If we assume HD can improve margins to 12% (from 11%) and grow NOPAT by just 6% compounded annually for the next decade, the stock is worth $241/share today – 6% above its current price, with even more upside should a market crash bring HD’s price down even further. See the math behind this reverse DCF scenario.
Industry Leader with Leading Profitability
From Home Depot’s Investor Presentation, HD is the #1 home improvement retailer in the United States, Canada, and Mexico. Furthermore, the firm estimates it has captured just 15% of its total U.S. market opportunity of ~$650 billion.
Our research indicates HD has leveraged its industry leading position to achieve greater profitability over its peers. Of the five Home Improvement Products & Services Retailers under coverage, HD has the highest ROIC and second highest NOPAT margin. HD’s profitably looks particularly impressive against its closest peer, Lowe’s Companies. Per Figure 6, HD’s NOPAT margin is nearly two times greater than LOW’s while its ROIC is nearly three times greater.
Figure 6: HD’s Profitability Advantage Over LOW

Sources: New Constructs, LLC and company filings
Executives’ Interests Aligned with Shareholders’ Interests
It’s no coincidence that HD has significantly improved margins, profits, and ROIC over the past decade, its executives are paid to do so. In fiscal 2007, Home Depot added an ROIC performance goal to its long-term incentive plan. The firm’s proxy statement noted the decision to add ROIC was “based on the Company’s desire to focus management on the efficient use of capital.” Since adding ROIC to its executive compensation plan, HD has improved ROIC from 15% in 2007 to 32% TTM.
In its latest proxy statement, HD disclosed that one half of executives’ performance based share awards are contingent upon achieving a target three-year average ROIC goal. The performance share award makes up anywhere from 29-33% of executives’ total compensation. HD’s executive compensation plan lowers the risk of investing in the company as we know its executives are incentivized to create true shareholder value. This compensation plan, along with strong fundamentals earned HD a spot in February’s Exec Comp Aligned with ROIC Model Portfolio.
Macro Conditions Bode Well for HD
Going forward, macro-economic data suggests continued growth for Home Depot and the home improvement industry in general. According to data from the American Housing Survey and Home Depot, over 50% of homes in the U.S are over 40 years of age, and nearly 80% of homes are over 20 years old. Home Depot notes that home improvement spend per home increases with the age of the home.
Additionally, homeowners have greater capacity to improve their homes than any time in history. CoreLogic, an industry data provider, reported that homeowner equity reached all-time highs in the first half of 2019 while homeowner equity has more than doubled since the housing recovery began. Home equity allows homeowners greater financial freedom when undergoing a home improvement project and bodes well for the home improvement industry.
The Importance of Quantifying Expectations
At the end of the day, a decline in these companies’ stock prices would change very little about the strength of their businesses. When searching for value, it’s important to understand the expectations already baked into a stock price. Our Company Valuation Models incorporate all the data from financial filings to truly assess whether a firm is under or overvalued and provide an accurate representation of the risk/reward in a stock.


