
These 3 Industries Tanked S&P Earnings
Some still ask how the market has done so well with such poor earnings. The answer is the bad industries make earnings look much worse than they are. Whenever you take out the worst of a group, the average always looks better, but in this case, the bad industries were really bad. This is because of COVID-19 of course. 36 industries had yearly earnings growth and 27 had declines. The decliners were much worse than the winners. Interactive media & services and software had $5.2 and $4.1 billion in yearly earnings growth.
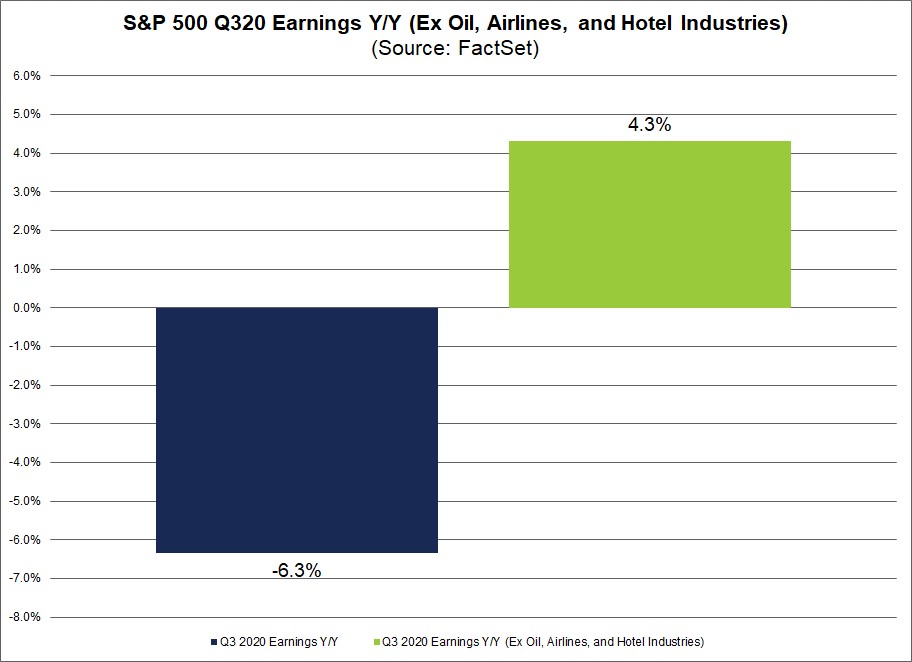
Oil, gas, and consumable fuels on its own more than counteracted those winners as its earnings fell $14.3 billion. Furthermore, the airlines and hotels, restaurants, & leisure had $13 and $9.7 in billion declines. This caused the delta between overall earnings growth and earnings growth without the three worst industries to be 10.6%. Overall S&P 500 EPS growth was -6.3%; growth without the three worst industries was 4.3%. This helps explain how stocks have done so well. Most traders would have called you insane in early April if you stated Q3 EPS would be up without the three worst industries. Results have dramatically beaten what the consensus expected in the spring which is why the market is much higher than it was then.
Retail Sales Continues Q3 Trend
We mentioned how the BAC card spending data was much better than the Chase data in a previous article. The details of the BAC reading are in tune with Q3 earnings season. Nothing changed because the new normal created by COVID-19 is still in place. If anything, the new normal is more deeply ingrained than ever because we have record-high cases and hospitalizations due to the virus. The 7 day average of deaths has unfortunately gone vertical.
Retail/spending trends pic.twitter.com/13sF7d85Gl
— Thunderdome Capital (@MadThunderdome) November 19, 2020
As you can see from the table above, the yearly decline in airlines spending was 62% as of November 14th. The seasonally popular pre-Thanksgiving travel period is not going to have as much action as it usually does (although TSA throughput yearly growth hasn’t dipped as of November 22nd). Spending at restaurants and bars went from up 6% on November 11th to down 10% on the 14th. Normally, a few days wouldn’t matter, but in this case, it does because restrictions are increasing. The yearly decline in dining reservations on OpenTable went from -42.8% on November 11th to -50.7% on November 22nd. The restaurant industry is looking grim. On the other hand, working from home is still popular. The 7 day average of yearly growth in online electronics (card not present) was 124%.
Which Way Is The Economy Headed?
The economy is headed downwards in the 2nd half of November because of COVID-19. Many indicators still show optimism because most data from October and early November was solid and because the markets have been strong. Prognosticators aren’t as sanguine. Merrill Lynch estimates that if PUA and PEUC benefits are allowed to expire on December 26th, there could be a 1.5% drag on Q1 GDP growth. JP Morgan thinks Q1 GDP growth will be -1% because of the virus. It’s possible the vaccines turn the economy around in the spring. It’s uncertain how deep the slowdown will be and how quick the turnaround will be. JP Morgan believes Q2 GDP growth will be 4.5% and Q3 growth will be 6.5%.
The New York Fed Weekly Economic Index improved to -2.84 for the week ending November 14 from -2.96 the week prior. That's the slowest pace of improvement in four weeks, but it's still surprising to see this rising given the surge in virus cases so far this month. pic.twitter.com/nwP1MROJv1
— RenMac: Renaissance Macro Research (@RenMacLLC) November 20, 2020
The Atlanta Fed’s GDP Nowcast shows Q4 growth will be 5.6% because October’s economic data was good. Similarly, the chart above shows the NY Fed’s weekly economic index rose from -2.96 to -2.84 in the week ending November 14th. That was the lowest improvement in 4 weeks, but any improvement is a positive given the spike in virus case. Finally, the ECRI leading economic index rose from 141.9 to 143.8 in the week of November 13th which brought its yearly growth rate from 7.4% to 8.6%. The ECRI index is always impacted by markets. The coincident index’s growth rate rose from -0.4% to 1.9% in October, showing it was a good month for the economy like we said.
Very Strong Housing Market
The housing market stayed strong according to this week’s data. Yearly MBA applications growth rose from 16% to 26%. We didn’t think above 20% growth would be hit again. This has been an unreal year for the housing market. It’s being boosted by low rates and demographics. This past week the average 30-year fixed mortgage rate fell to 2.72% which is a record low. The two most common age groups are 25-29 and 30-34 which means millennials are just entering their prime home-buying years.
NAR: Existing-Home Sales Increased to 6.85 million in October https://t.co/tcnhXto8OT pic.twitter.com/Jc5ydqtYVO
— Bill McBride (@calculatedrisk) November 19, 2020
As you can see from the chart above, existing home sales have gone vertical. That’s the highest sales rate since 2006. In October, sales rose from 6.57 million to 6.85 million which demolished the highest estimate which was 6.68 million. Somehow in the hottest housing market since the housing bubble, economists called for a decline. Instead, there was 4.3% growth. Yearly growth was 26.6%.
Amazingly, in May existing home sales were down 26.6% yearly. That’s an amazing turnaround brought to you by COVID-19. The huge reversal is why there is such little supply of homes. Unsold inventory fell from 2.7 months to 2.5 months which is a record low. As you can see from the chart below, properties stayed on the market for 21 days which is down from 36 days last year.
First-time buyers were responsible for 32% of sales in October; Individual investors purchased 14% of homes; All-cash sales accounted for 19% of transactions; Distressed sales represented less than 1% of sales; Properties typically remained on the market for 21 days. #NAREHS pic.twitter.com/5Q8140PlXB
— NAR Research (@NAR_Research) November 19, 2020
Median home price growth was 15.5% as it rose from $271,100 to $313,000. That’s the 104th straight month of growth. Clearly, double-digit price growth can’t be maintained. The housing supply is coming. October housing starts rose from 1.459 million to 1.53 million. Permits stayed at 1.545 million. The housing market index (homebuilder confidence) rose from 85 to 90 in November.
Conclusion
Without the parts of the economy that have tanked because of COVID-19, Q3 S&P 500 earnings growth would have been positive. Retail spending on these hard-hit areas remained weak in November. If there wasn’t a 3rd wave of COVID-19, Q4 GDP growth would have been very solid as October was a good month. Expect negative growth in Q1. The housing market stayed hot in the fall as existing home sales went vertical. Housing supply is coming as homebuilders are confident, price growth is high, and starts are increasing.
Disclaimer: The content on this site is for general informational and entertainment purposes only and should not be construed as financial advice. You agree that any decision you make will be ...
more

