
The Trade-Off Between Upside Participation And Downside Protection
Financial market history is rife with prolonged bull market periods and deep corrections. With no proven way to correctly time the market, market participants can stay fully invested and attempt to capture the potential upside, but they also have to endure and recover from the full depths of drawdowns. Hence, some market participants may choose a tradeoff to mitigate the most severe downside by forgoing a portion of the upside.
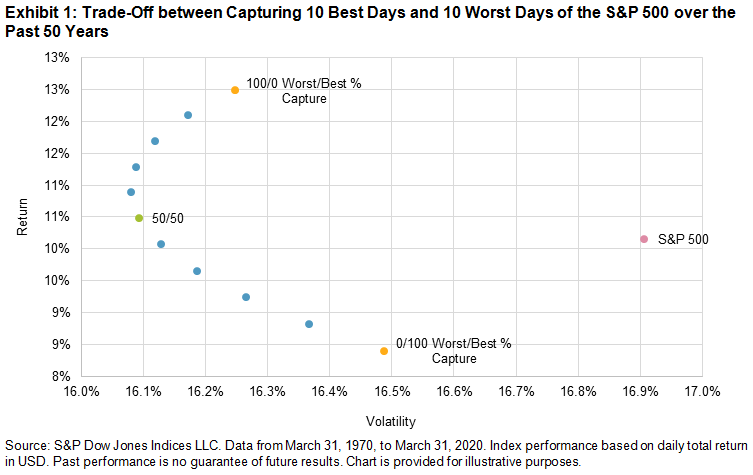
We illustrate the intuition behind the tradeoff in a simple analysis. For example, if we had invested USD 1,000 in a portfolio tracking the S&P 500® in 1970, after 50 years, it would be worth USD 125,458. That number would drop by half to USD 56,389 if we missed the 10 best days, or almost triple to USD 359,233 if we avoided the 10 worst days.
Exhibit 1 highlights varying degrees of hypothetical tradeoffs between upside participation and downside capture—if one were able to capture 10%, 20%, 30% … return on the 10 worst days and 90%, 80%, 70%… return on the 10 best days.
The shape of the tradeoff curve shows that the 50/50 trade-off scenario (green dot in Exhibit 1) outperformed the S&P 500 with lower volatility. This implies that investors can indeed trade substantial upside participation for downside mitigation and still maintain the potential to come out ahead.
This observation is especially relevant for investors relying on their investments for retirement income, as they need protection from short-term drawdowns. Withdrawals for annual living costs make it hard to recover from those losses, and an adverse sequence of market returns may accelerate the depletion of their accounts.
(Click on image to enlarge)
The S&P Managed Risk 2.0 Index Series is designed based on the observation around this trade-off. The indices dynamically adjust the exposure between a risky asset and a reserve asset to target a predefined volatility level and add an additional layer of capital management, with the cost of protection embedded in the strategy and financed through the reserve asset in the form of a synthetic put hedge.
The strategy dials down participation in risky assets when market volatility is high, and hence aims to avoid the most severe down days. In order to achieve this, it gives up some participation in the up market days, as protection comes with costs. When the market is stable, on the other hand, the strategy increases allocation to risky assets and maintains full equity allocation in calm periods.
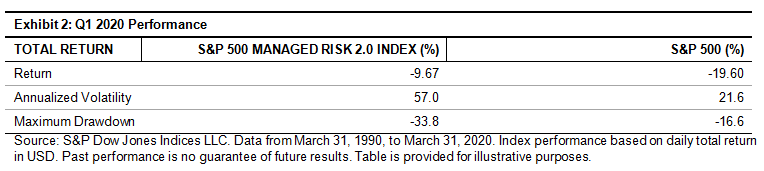
In the first quarter of 2020, the S&P 500 Managed Risk 2.0 Index demonstrated its potential ability to provide protection. The index quickly de-risked by allocating to safer assets—a change from full allocation to equity on Feb. 20, 2020, to a mere 17% equity allocation as of the end of March 2020. As a result, it maintained volatility at one-third of the S&P 500 and reduced drawdown by half of the S&P 500.
(Click on image to enlarge)
Not only that, the 30-year historical performance showed that the S&P 500 Managed Risk 2.0 Index would indeed provide a much better outcome for retirees when it is used as a construction tool in a core portfolio.
Following 30 years of decumulation using the back-tested data from March 1990 to March 2020, the account value under the managed risk approach was 111% more than the account value using the traditional 70/30 equity/fixed income blend. When withdrawals are factored in, the relative excess value generated by the managed risk approach was not merely maintained, but improved upon.
(Click on image to enlarge)

Markets time and time again prove that they are susceptible to large shocks and difficult to time accurately. For those concerned about extreme drawdowns and are willing to give up a portion of their upside potential, strategies such as S&P Managed Risk 2.0 Indices can play a role in smoothing out returns.
The information provided is for informational purposes only and investors should determine for themselves whether a particular service or product is suitable for their investment needs. Graphs and ...
more

