


Rudyard Kipling, “If you can keep your head when all about you are losing theirs… Yours is the Earth and everything that’s in it, And—which is more—you’ll be a Man, my son!”
What you read below will probably not make sense until we look back on it a month or so from now, but here it goes…
The vast majority of this article was written on Wednesday evening. Since that time, Russia has reportedly invaded/struck non-separatist regions in Ukraine. As of this addendum on Thursday morning, NATO and the US have done nothing to deter Russia, beyond a few modest sanctions.
For context, the last instance of Russia's aggression was when President Biden was then Vice President under President Obama. While not a perfect comparison, it can give us some insight as to how things could play out. History doesn’t repeat, but it does have a tendency to rhyme…
According to Wikipedia’s account:
“In February and March 2014, Russia invaded and subsequently annexed the Crimean Peninsula from Ukraine. This event took place in the aftermath of the Revolution of Dignity and is part of the wider Russo-Ukrainian conflict.
On 22–23 February 2014, Russian President Vladimir Putin convened an all-night meeting with security service chiefs to discuss the extrication of the deposed Ukrainian president, Viktor Yanukovych. At the end of the meeting, Putin remarked that “we must start working on returning Crimea to Russia”. On 23 February, pro-Russian demonstrations were held in the Crimean city of Sevastopol. On 27 February, masked Russian troops without insignia took over the Supreme Council (parliament) of Crimea and captured strategic sites across Crimea, which led to the installation of the pro-Russian Sergey Aksyonov government in Crimea, the conducting of the Crimean status referendum and the declaration of Crimea’s independence on 16 March 2014. Russia formally incorporated Crimea as two Russian federal subjects—the Republic of Crimea and the federal city of Sevastopol on 18 March 2014. Following the annexation, Russia escalated military presence on the peninsula and leveraged nuclear threats to solidify the new status quo on the ground.”
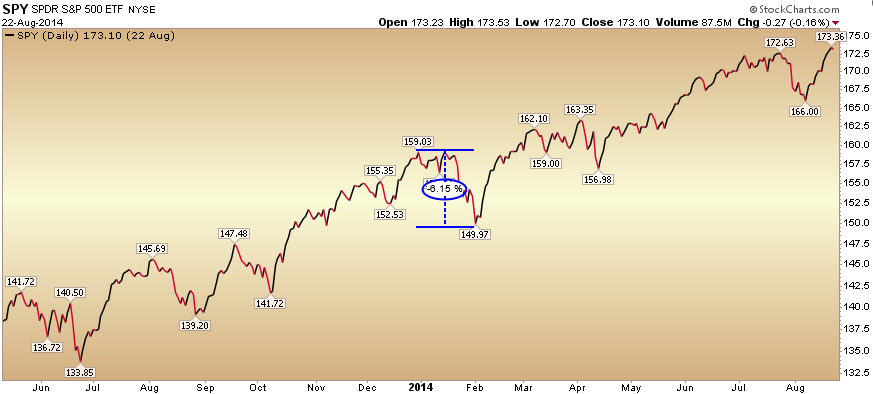
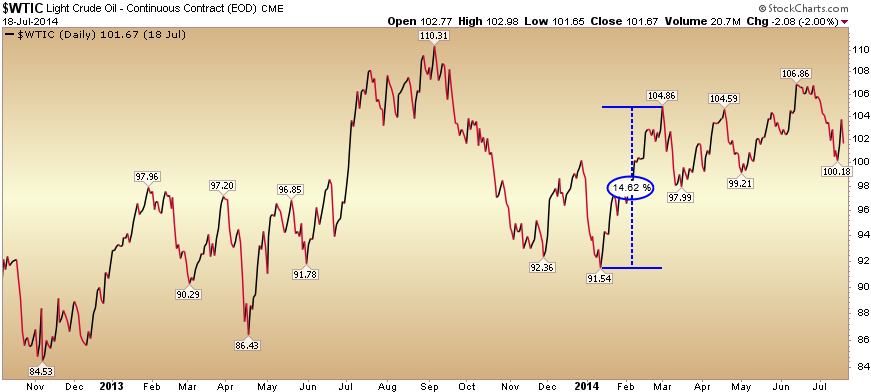
Here’s what happened to the S&P 500 and to WTI Crude Oil prices during this period – February/March 2014 (S&P down ~6%, WTI Crude up ~15%):
(Click on image to enlarge)
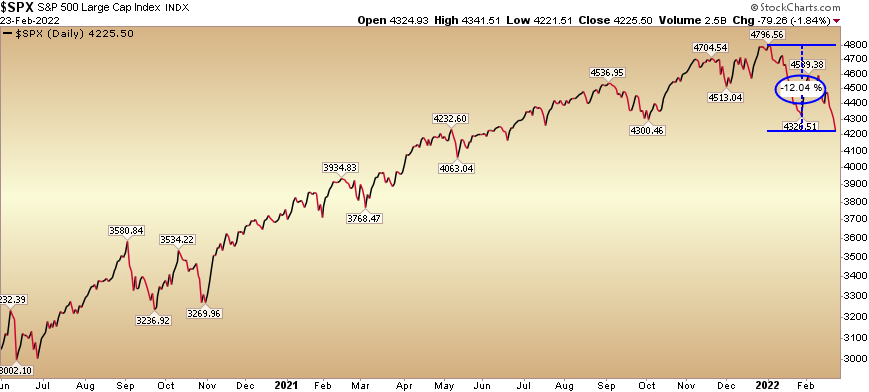
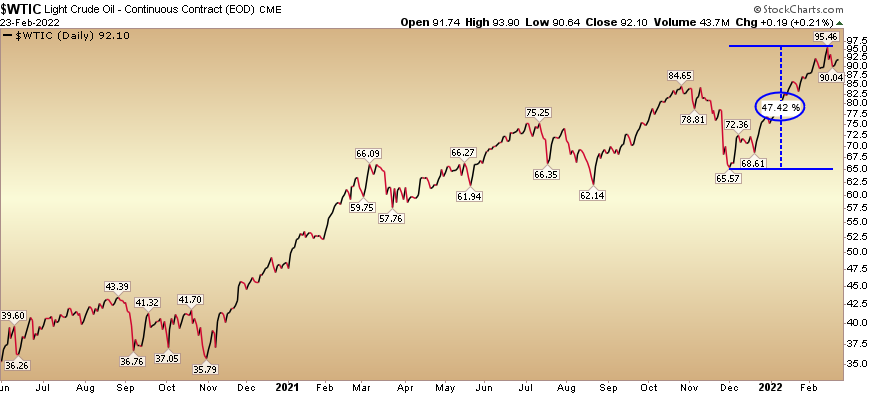
The Russia/Ukraine risk has been in the markets for some time now and here is what has happened so far (S&P down ~12%, WTI Crude up ~47%):
(Click on image to enlarge)
Looking back at all of the geopolitical events since 1940, the data supports our view that the disruptions should be relatively short-lived. Data per Ryan Detrick/LPL Financial:
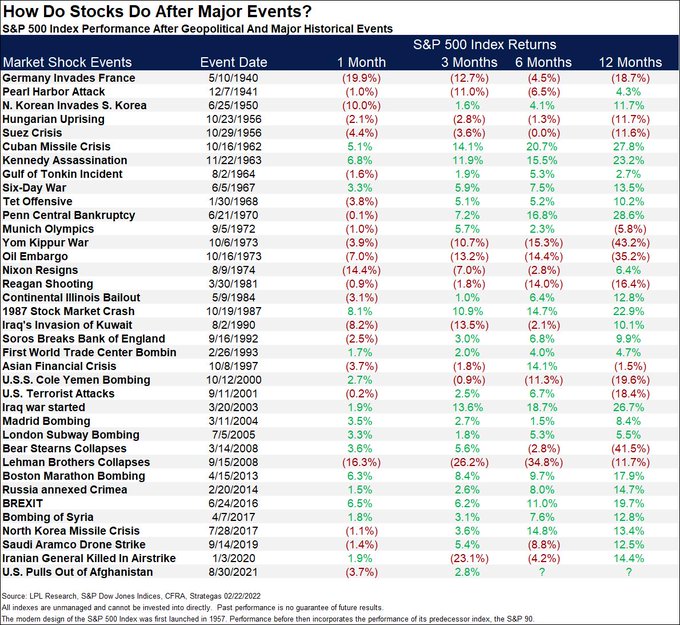
As such, we will use any further strength in Oil to harvest profits in Energy stocks (predominantly Exploration and Production names). Oil servicers should benefit from a consistent rig count increase in the coming months as more supply comes onto the market. We will redeploy that capital into pockets of Biotech and Chinese/US tech that are reasonably valued – but selling off indiscriminately due to general fear in the market.
For example, do you think Russia’s invasion of the Ukraine will impact how many drug prescriptions are written in the next few months? How about number or Doctor visits, screenings, tests – or whether people take their medicine each morning? Will it impact how many people log onto Facebook to see pictures of their friends and family? We don’t. It may temporarily impact the price of the stocks (incrementally more than it already has), but the underlying business fundamentals will be unimpaired.
Wall Street is the only place on earth that when they throw a “clearance sale”, no one shows up…
Now onto our original article from Wednesday evening:
Wednesday afternoon I joined Karina Mitchell on Yahoo! Finance to discuss the relentless selling in the stock market since ~January 5. Thanks to Karina, Taylor Clothier, and Sara Dramer for having me on. Watch here to get my full thinking on the market, sectors, and what we are buying versus selling
My starting headline was that “the biggest risk to the market in coming weeks is to the UPSIDE at these levels.”I proceeded to lay out the relevant facts to make my case.
The market is scared of the Fed, Inflation, and Putin, however, much of it is already priced in:
- 7 rate hikes are now priced into the short end of the curve.
- The biggest fear (Putin would invade Ukraine) has already happened.
- ~200 of the 500 S&P 500 components are currently down 20% or more.
What does this mean?It means that the market has spent ~7 weeks “selling the rumor” and it is now nearing the point to “buy the news.”
SENTIMENT: SENTIMENT IS WASHED OUT:
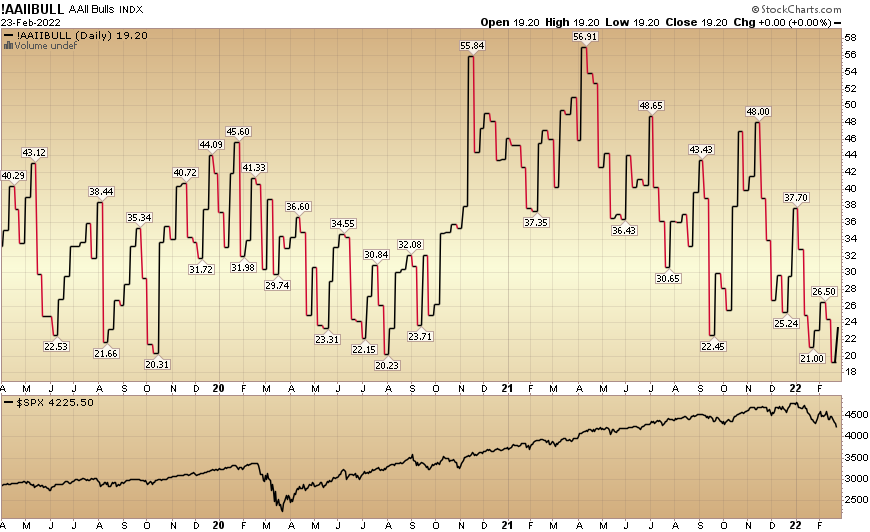
- AAII Sentiment Survey: Retail Bullish Percent down to 19.20 last week – historically found near lows.
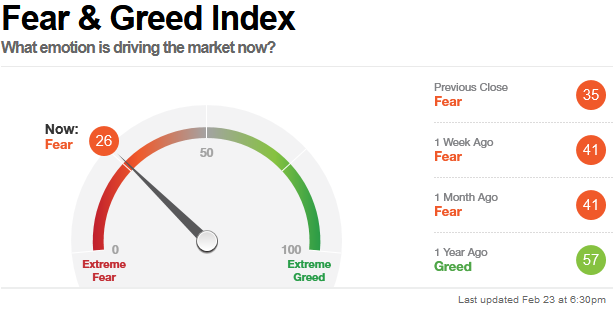
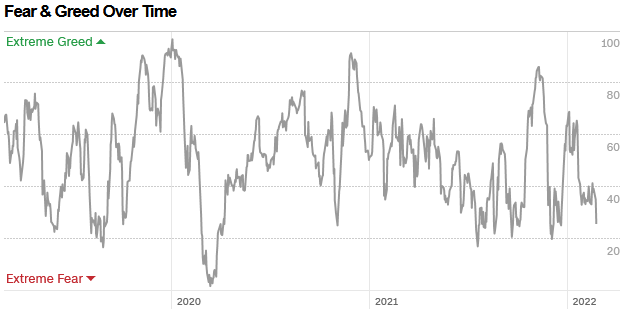
- CNN Fear & Greed Index: 26 = Fear
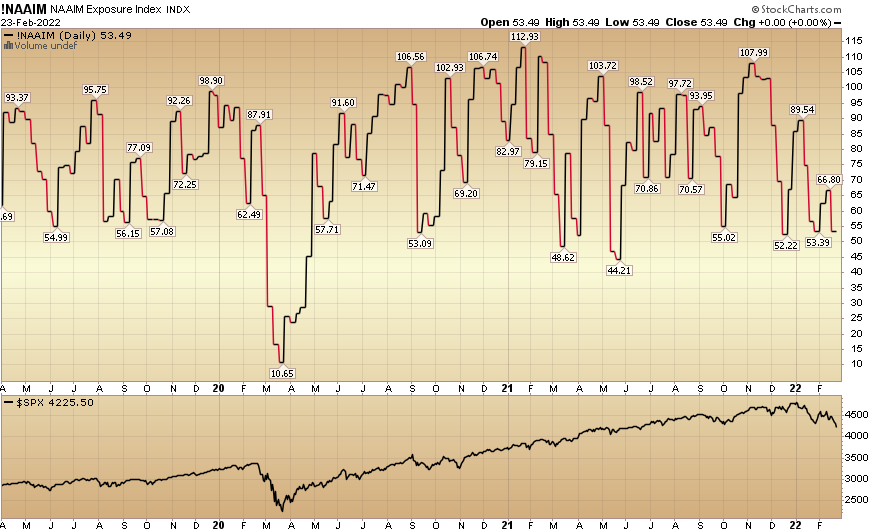
- National Association of Active Investment Managers: Equity exposure at just 53.49% found near bounces and bottoms.
- Put:Call Ratio hit 1.12 on Tuesday. Found near bottoms.
POSITIONING:
~24% – to get back to average Price to Book multiple.
~155% – to get back to average Price to Operating Cash Flow multiple.
~112% – to get back to average Forward P/E multiple.
Remember: recovery rallies never stop at their “average.”Just as they overshoot in pessimism on the downside, they overextend in euphoria on the upside.
It has paid investors to maintain a cyclical bias leading up to the first hike. However, the performance in the three months following that hike has struggled.”
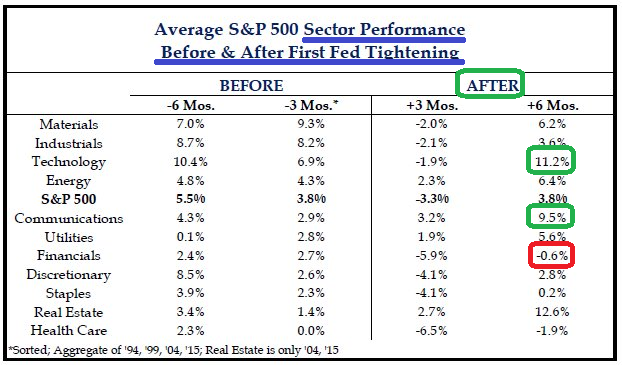
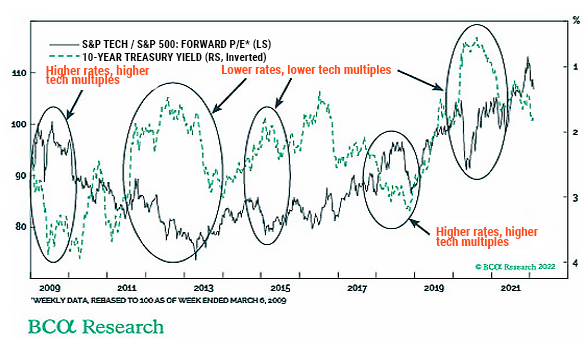
*This is not what the majority of market participants are expecting OR positioned for.
The time to buy insurance is BEFORE your house is on fire! We were buying banks and energy in fall 2020 in ANTICIPATION of rising growth, rates, and inflation. Now, in anticipation of moderating growth (GDP ~6% 2021, ~4% 2022, back to trend in 2023), we are buying those sectors which can grow in the face of a slowing environment: Namely Biotech (Sector) and Chinese Tech – Alibaba.
PILLARS FOR THE MARKET:
- Buybacks: $234T authorized for 2022 so far (all-time record).
- Money Supply/Liquidity Still Growing (but slowing rate of change will help inflation moderation on a lagged basis). Growth rate peaked at 12% in Feb 2021.
- Earnings are still RISING: $47 2022 est.$247.53 2023 est. Earnings Growth: For Q4 2021, the blended earnings growth rate for the S&P 500 is 30.9%. It will mark the fourth straight quarter of earnings growth above 30%.
- The 10-yr treasury yield: has been below 3% twenty percent of the time post-WWII. In those periods, the market’s performance is 2x as good as when it is above 3%.
- Consumer Confidence has only been this low 3% of the time post-WWII. Despite this fact, Retail Sales surged in January and JP Morgan Chase Credit Card data (up 8% and continuing in February) was the highest in a decade.As consumer sentiment and inflation are joined at the hip, we expect the consumer to improve even more as inflation begins to moderate in the coming months.
_________________________________________________
Follow the Big Dogs…
Each week we look at the Commitments of Traders report put out by the CFTC. We are most interested to see how the big players (COMMERCIALS – GREEN LINE AT BOTTOM) are positioning. In the two charts below (Nasdaq and Dow) I have drawn vertical lines showing when commercials were buying ahead of a big up move. You can see what happened next:
(Click on image to enlarge)
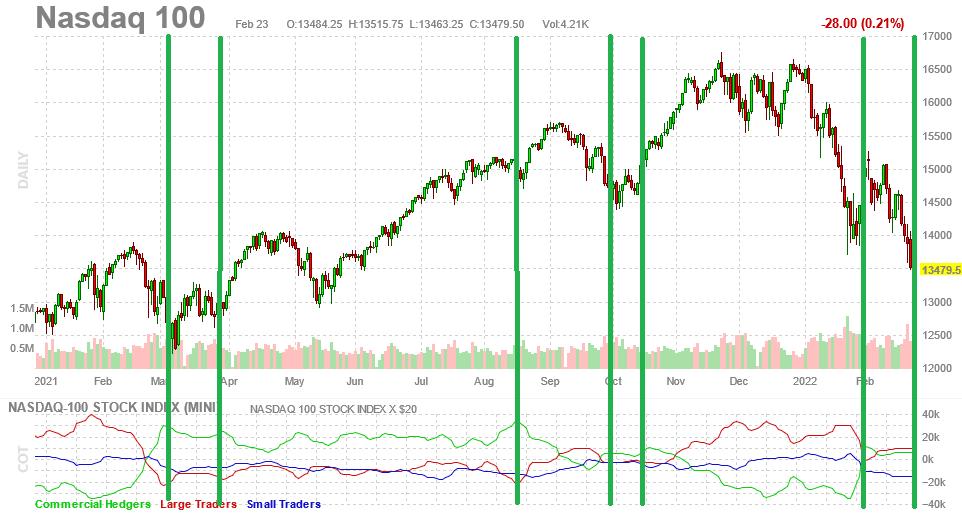
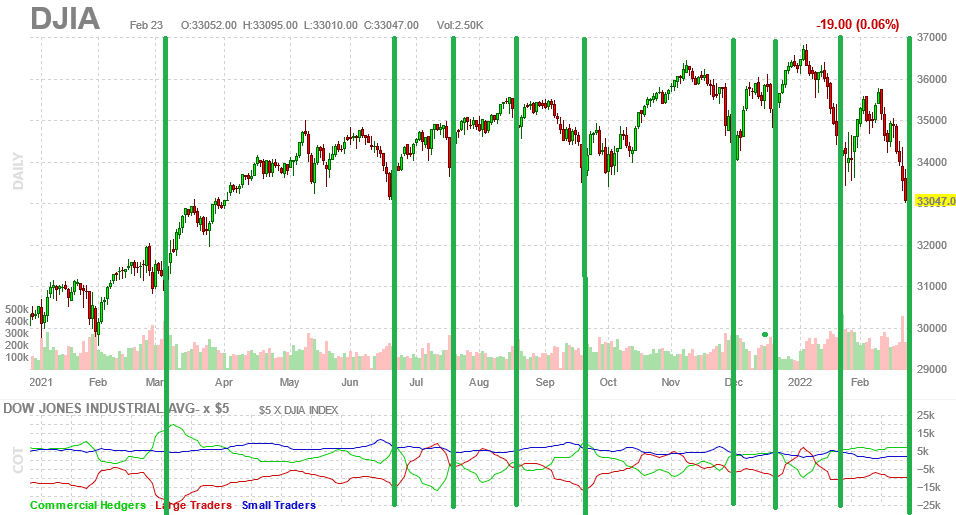
Commercials have been buying aggressively and we are following suit (albeit in a targeted way – mostly adding to biotech and Chinese tech – which have a fundamental “margin of safety” embedded in their current low valuations). This contrasts with many of the “story stocks” that are down 50-80%+ and are still trading at >10-20x SALES – while aggressively and un-apologetically losing money every quarter (these are still “no touch”).
Final Points
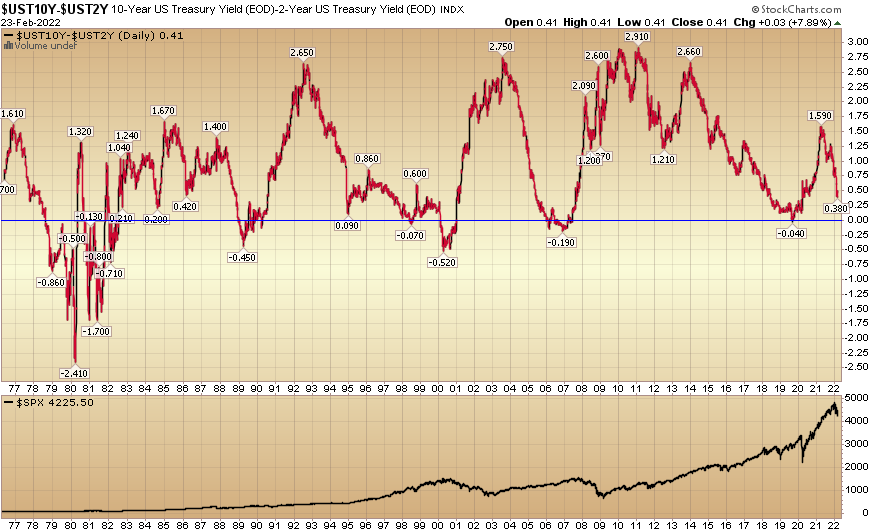
To get a bear market correction of ~20%, you need a recession. To get a recession, you first need a yield curve inversion. While the yield curve is flattening, it is not yet near inverting:
(Click on image to enlarge)
Now onto the shorter term view for the General Market:
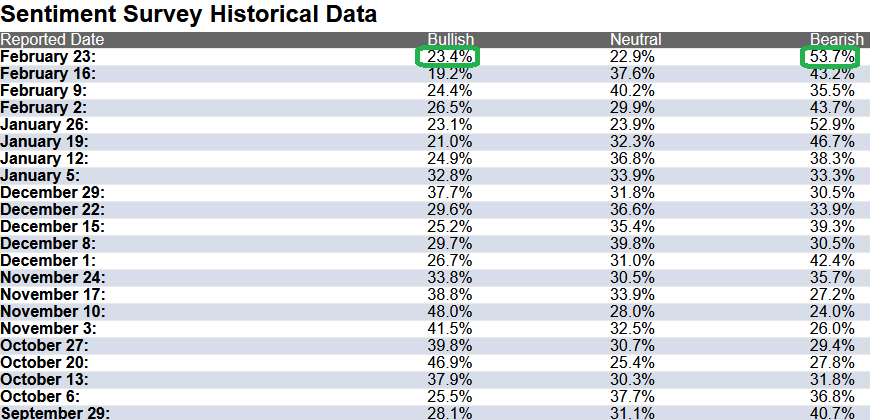
In this week’s AAII Sentiment Survey result, Bullish Percent (Video Explanation) ticked up to 23.4% this week from 19.2% last week. Bearish Percent rose to 53.7% from 43.2%. Retail trader/investor fear is at a level historically consistent at/near market lows.
(Click on image to enlarge)
The CNN “Fear and Greed” index dropped from 41 last week to 26 this week. There is meaningful fear in the market. You can learn how this indicator is calculated and how it works here: (
)
And finally, this week the NAAIM (National Association of Active Investment Managers Index) (Video Explanation) dropped to 53.48% this week from 66.80% equity exposure last week. Managers will have to chase any strength in the coming weeks.
(Click on image to enlarge)
Comments
Log in or sign up to join the conversation.