
The Short-Term Trend For Year End
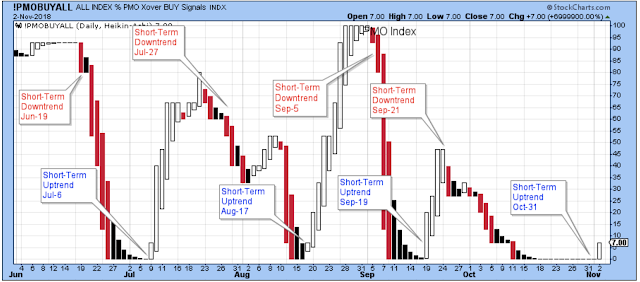
A short-term uptrend started Oct. 31, and we finally started to get confirmation from the PMO index on Nov-3 with an attractive looking tick higher.
What indicators gave away the new short-term uptrend on Oct. 31? The Bullish Percents did their part. This is a nice little turn around in trend.
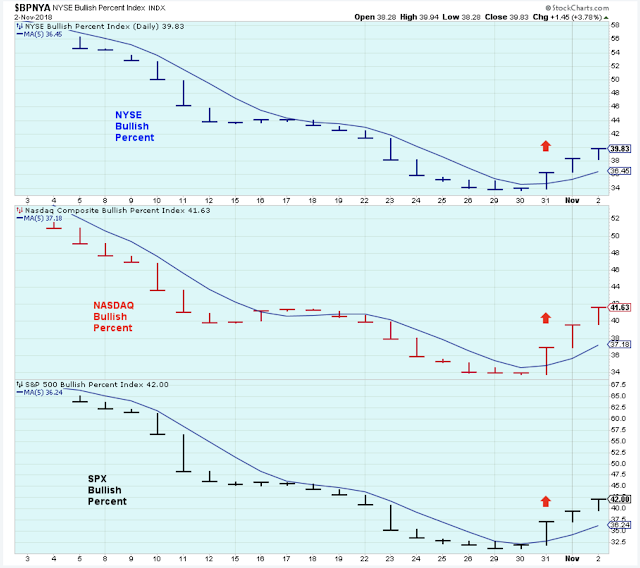
The number of new 52-week lows has dropped back down to a level where stock prices do a better job of moving higher, and where it is a bit safer for us to try to take advantage of the uptrend. But watch this chart everyday. In this shaky market environment, new lows could start to increase again and that would ruin things short-term.

I haven't made any short-term purchases. I am not sure if I will.
The Long-Term Outlook
I'm calling it. My long-term accounts are going defensive. I'm building a moat, and doing what I can to protect what I have.
The ECRI is now decisively below the zero-level where economic trouble and lower stock prices tend to occur. Of course, the ECRI index could whipsaw and start to move higher at any time, so you have to continue to pay attention to it.
For me, defensive means selling stocks into strength, and not making any new purchases. I am not sure if I will sell all holdings, but a large percentage will be sold.
Also, I am not sure if I will buy any inverse funds to make money as the market goes lower. We'll see.
How fortunate we are to have this index available and published for free.

Is it playing with fire to hang onto stocks that are headed lower just to get a better price on a counter-trend rally? Should I sell the weaker stocks first, or should I also sell strong stocks to lock in profits, and not worry about the potential for a rally?
Knowing me, I will do a little bit of both for awhile. And then one day, I'll just start selling aggressively.
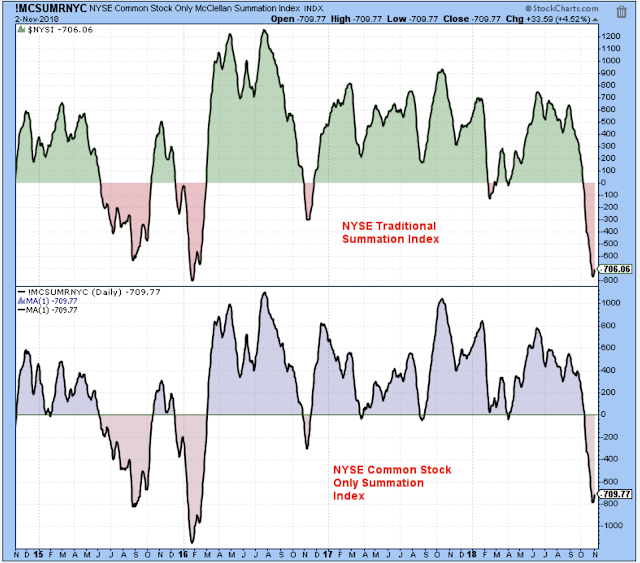
These Summation Indexes are down to levels where the market has started to bounce off its lows.
Is this drop in oil prices good or bad for stock prices? It's bad for oil and commodity stocks, of course. But a lower oil price means there is less pressure for higher rates which is good for Technology stocks and bad for rate-sensitive Financials.
At the moment, however, I think most market watchers feel that lower oil reflects weakening global demand which therefore means a softening global economy, and that can't be good for stock prices.
IMHO, a break below this support would be another tick in favor of moving out of stocks and into cash, but if oil prices hold here, then it might not be so bad for stock prices overall.

Could the weakness in oil prices partly explain this week's strong rally in the Semiconductor stocks? This is a very bullish looking outside week, but with so much overhead supply I would expect this rally to struggle as the index reaches back up under the neckline.

For the stock price optimists, we still don't have a sell signal from junk bonds.

More good news for bulls. The monthly uptrend of the SPX is holding right where it should at the uptrend line.
Wanna take bets? I say the SPX rallies about halfway to the all time high, turns lower, and then breaks below this trendline forming a head-and-shoulders.

What evidence do I have that the SPX will break below its trend? The SPX Equal-Weight has already started to break down. It doesn't look too bad yet, but I would say the trend is broken.

What else?
With all the talk of the election, tariffs, the caravan, etc., have we forgotten the real force behind what ultimately sets the value of stocks, bonds, businesses, real estate?
Long-term rates are certainly pointing higher, and this has occurred at a time when the world economy is starting to wobble.
We care about this chart because in the long-run, higher rates generally mean lower Price-Earnings multiples for stocks. So while judge the market based on worries about whether Apple is breaking out its sales of iPhones from MACs, just remember that longer-term rates might be the real headwind for stock prices.
Also, no one really pays much attention right now, but some day soon the enormous deficit financing of our Federal government is going to replace the current headlines.

Rates
Rates continue to be headed higher for all durations which means lower fixed income prices. In other words, as I am selling stocks, I will keep the proceeds in cash or short-term T-Bills for now.

Outlook Summary:
The long-term outlook is negative.
The medium-term trend is down as of Oct-4.
The short-term trend is up as of Oct-31.
The medium-term trend for bond prices is down as of Sep-7 (prices lower, yields higher).
Investing Themes:
Strategy During a Bull Market:
- Buy large cap stocks and ETFs at the lows of the medium or short-term trends.
- Buy small cap growth stocks on breaks to new highs in the early stages of short-term up trends.
- Stop buying when the short-term trend is at the top of the range.
- Take partial profits when the uptrend starts to struggle at the highs.
- Never invest based on personal politics.
- During a bear market, stay mostly in cash.
MON Sector Strength - TUE Rates - WED Medium-Term - THU Commodities Currencies - FRI Sentiment - SAT Longer-Term
Disclaimer: I am not a registered investment advisor. My comments above reflect my view of the market, and what I am doing with my accounts. The analysis is not a recommendation to buy, ...
more

