
The Sheryl Crow, “Merry Christmas Baby” Stock Market (And Sentiment Results)…

In the spirit of the Holiday, we selected Sheryl Crow’s rendition of “Merry Christmas Baby” to embody the sentiment of the Stock Market this week. The salient lyrics are as follows:
I said, merry, merry, merry, merry Christmas, baby
You sure did treat me nice, yes, you did
Yes, you did, yes, you did, yes, you did
I said merry, merry Christmas baby
Sure did treat me nice…
There’s no question the markets have “treated us nice” in 2020, so now we look forward to how we can continue the streak in 2021…
On Tuesday I was on Fox Business, The Claman Countdown – with Liz Claman – discussing the “Year of the Retail Investor.” Thanks to Liz and Jacqueline D’Ambrosi Scales for having me on.
In the segment, I covered some key points on how Retail Investors have succeeded in 2020 and what to watch out for in 2021. You can view it here.
Santa Claus?
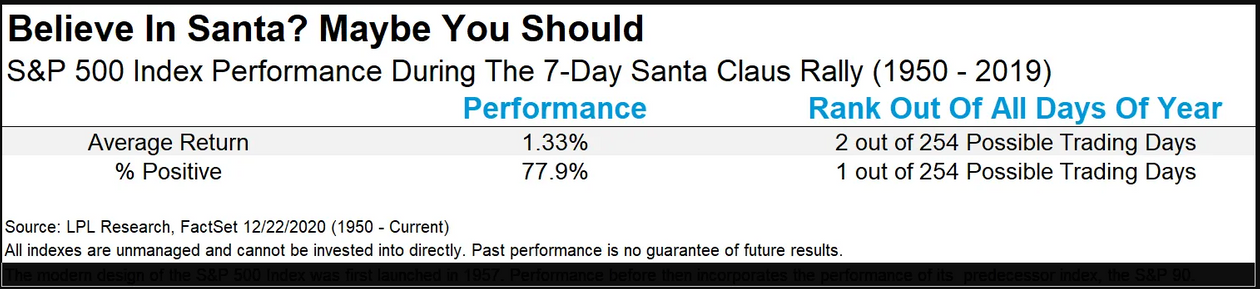
Santa has been good to us throughout the month of December, but the technical definition of a “Santa Claus” Rally starts on Christmas Eve and ends on the second trading day of 2021.
Ryan Detrich of LPL financial put out some useful stats to give us an idea of what we might expect:
(Click on image to enlarge)
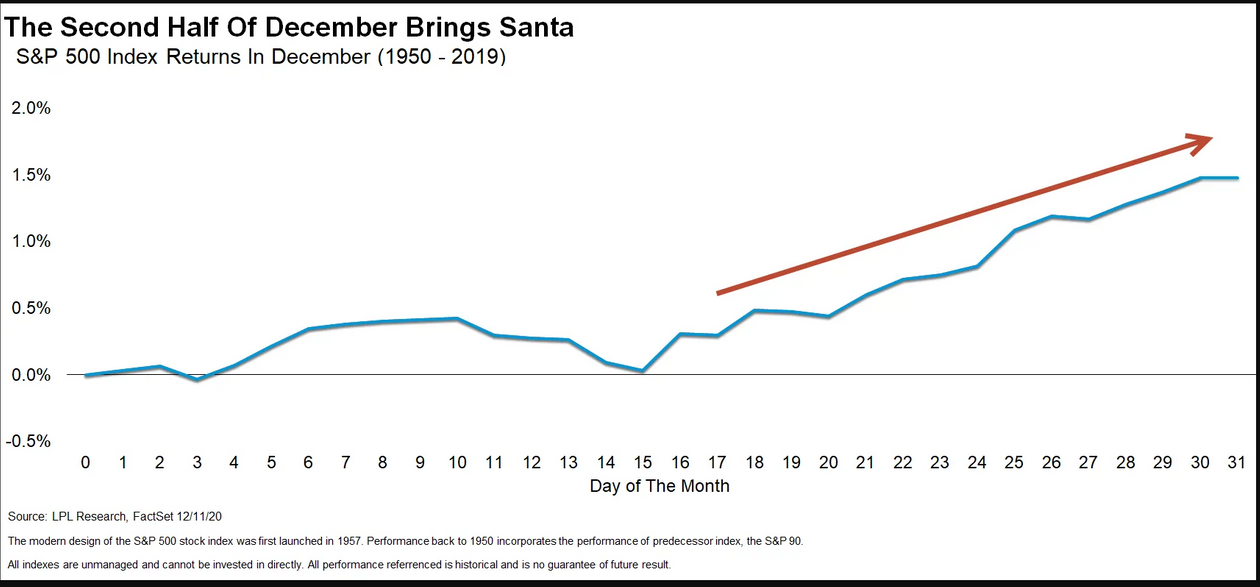
So while December has been nice, there may still be some gas left in the tank (if past is any prologue):
(Click on image to enlarge)
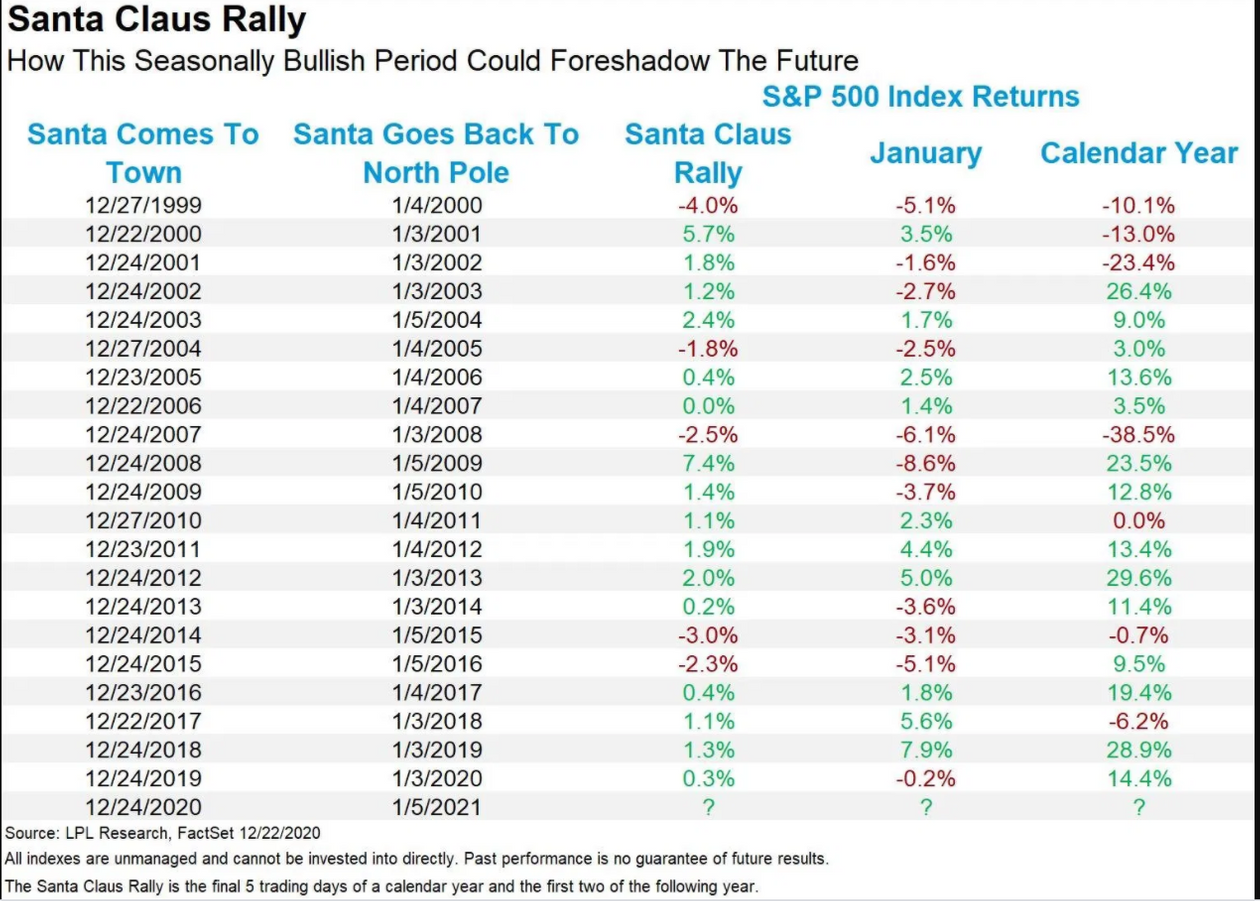
Detrick also points out that going back to the mid-1990s, “there have been only six times Santa failed to show in December, and in those instances January also brought a move lower five times, and the full year had a solid gain only once — in 2016, but a mini–bear market early in that year.” MarketWatch
So we want to see Santa work his magic, not only for the end of the year but for what it might signal moving forward:
(Click on image to enlarge)
History doesn’t repeat but it does rhyme…
Consistent with our rotation thesis – which we have been emphasizing since late Spring and Summer in our weekly notes
– Bret Arends posted the following chart on MarketWatch:
(Click on image to enlarge)
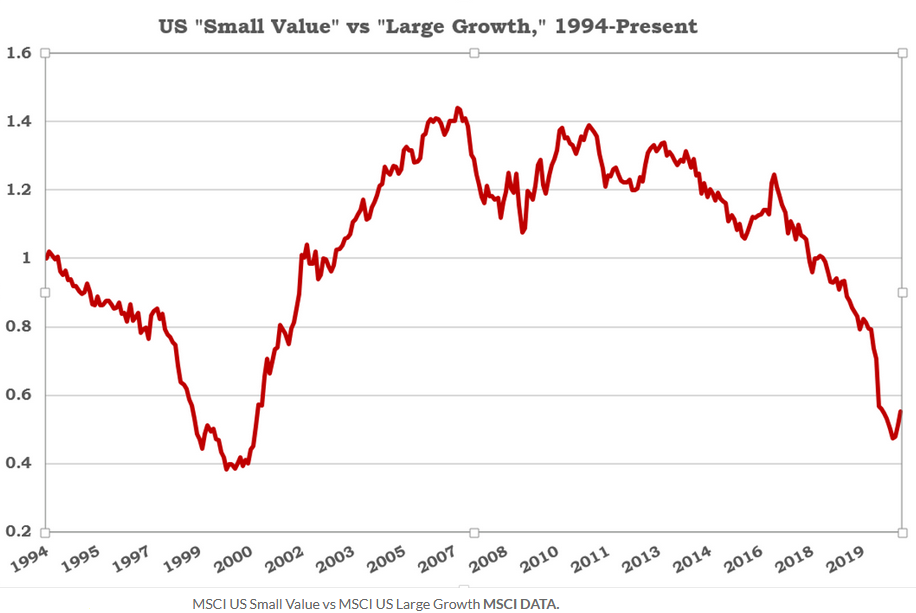
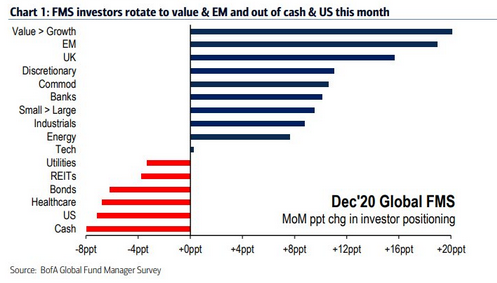
The nascent rotation from Large Cap Growth (FAANGM+) to small-cap value (banks and energy) is just beginning. We are in a new (post-recession) business cycle.
This is also consistent with our view that commodities/oil will have a multi-year boom cycle (along with Emerging Markets) that may rival 2001-2007.
Managers in the Bank of America Global Fund Manager Survey this month began to shift along these lines for the first time in years:
(Click on image to enlarge)
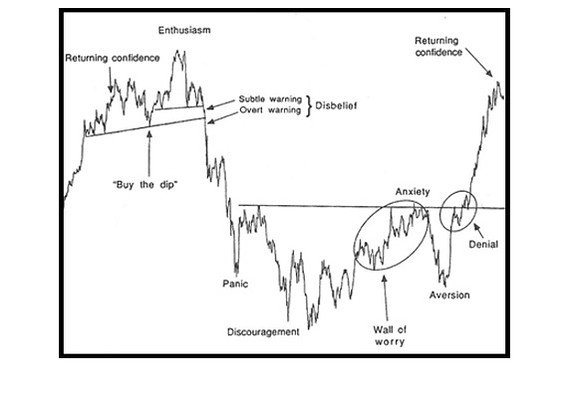
Sentiment Follows a Roadmap
In October I put out this roadmap of sentiment to explain the despondency in sentiment on Wells Fargo and how it would eventually turn around:
(Click on image to enlarge)
As it relates to Wells Fargo (WFC) – based on the sideways consolidation we have experienced the last couple of weeks – it looks like we may now be LEAVING the “Denial” phase and on our way to the “Returning Confidence” phase. If the roadmap continues along normal tendencies, it may be a quicker ride than anticipated:
(Click on image to enlarge)
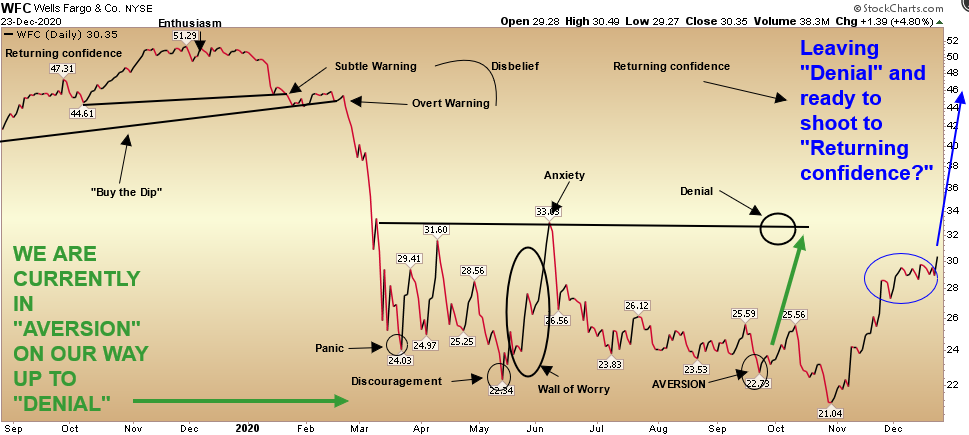
Always remember, “opinion follows trend.”No one wanted Wells Fargo a few weeks ago. Now that it’s up ~45% in six weeks, more and more people are talking financials. Here are three articles from yesterday alone:
- Wells Fargo set to be freed from AML consent order (American Banker)
- Banks Can Buy Back Stocks Again. Wall Street Is Cheering. (Barron’s)
- Bank Stocks Are Going to Be Higher Next Year, Expert Says (Barron’s)
In the mid $40’s “Returning Confidence” is when everyone will be talking the “turnaround story” (with Charlie Scharf) and that should be the next region where we consolidate sideways for a while. But until then, let’s enjoy the ride…
Now onto the shorter term view for the General Market:
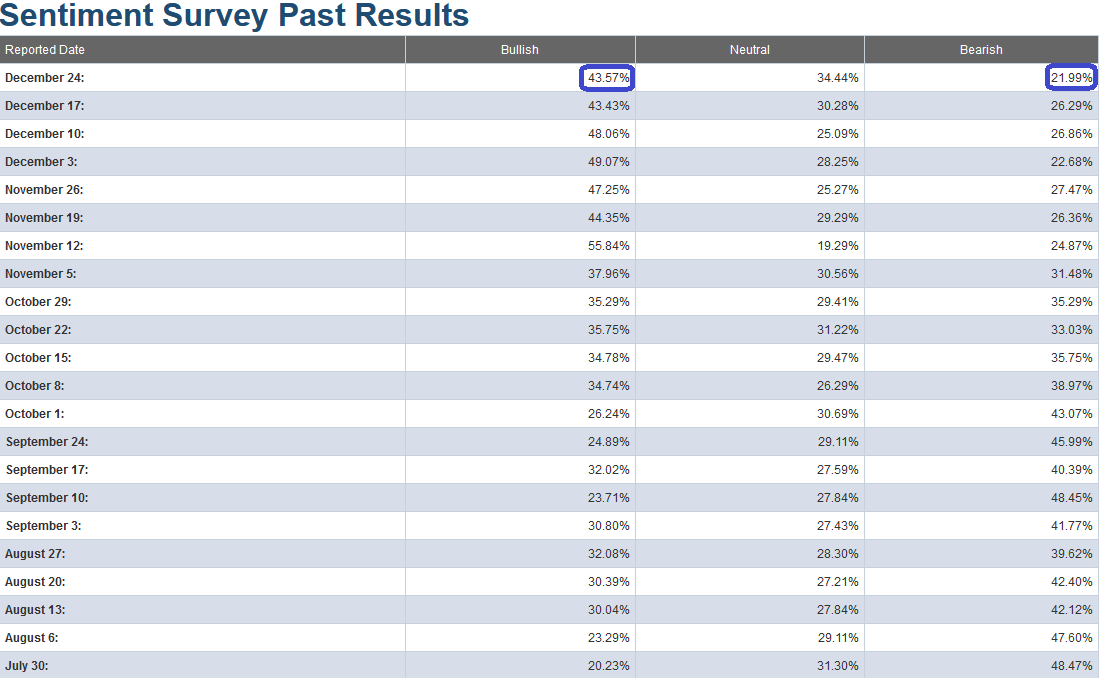
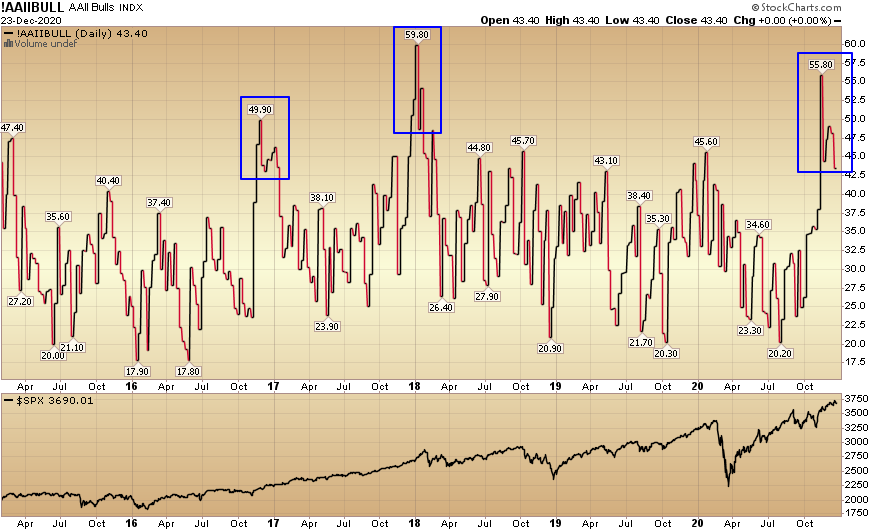
In this week’s AAII Sentiment Survey result, Bullish Percent (Video Explanation) flat-lined at 43.57% from 43.43% last week. Bearish Percent dropped to 21.99% from 26.29% last week. We are still at an extreme in sentiment for retail investors.
Just like last week – while this is still an extreme in short-term sentiment and should be heeded in the short-term – it is important to note in the chart below, that while similar levels presaged a short term top in early 2018, they occurred near the beginning of a longer-term uptrend at the end of 2016-2017 (right after the last Presidential election).
We noted the similarities between the pre-election stock-market in 2016 versus 2020 in our October 29, 2020 note. It has played out exactly according to script ever since, which is why I am inclined to give this extreme level in sentiment the same “benefit of the doubt” as late 2016. Just like then, most managers were off-sides and flat-footed going into the election and had to panic into the market to play “catch up” before year-end.
(Click on image to enlarge)
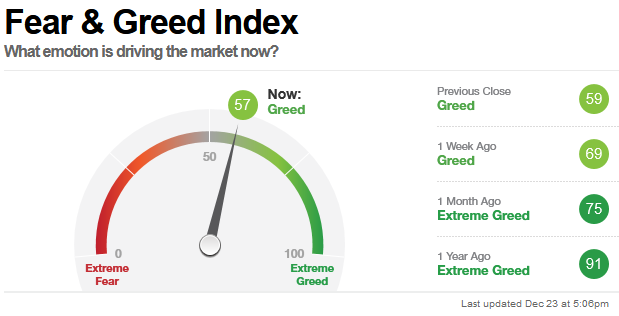
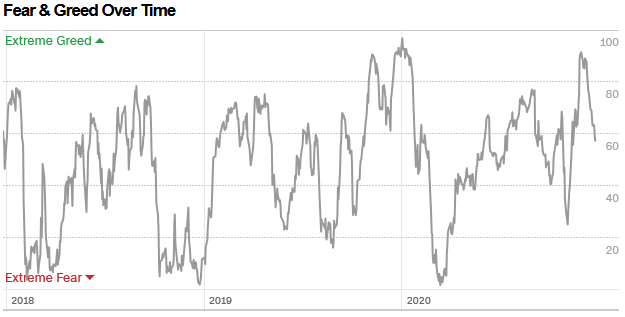
The CNN “Fear and Greed” Index dropped again from 69 last week to 57 this week. This is a relatively neutral read. You can learn how this indicator is calculated and how it works here: (Video Explanation)
(Click on image to enlarge)
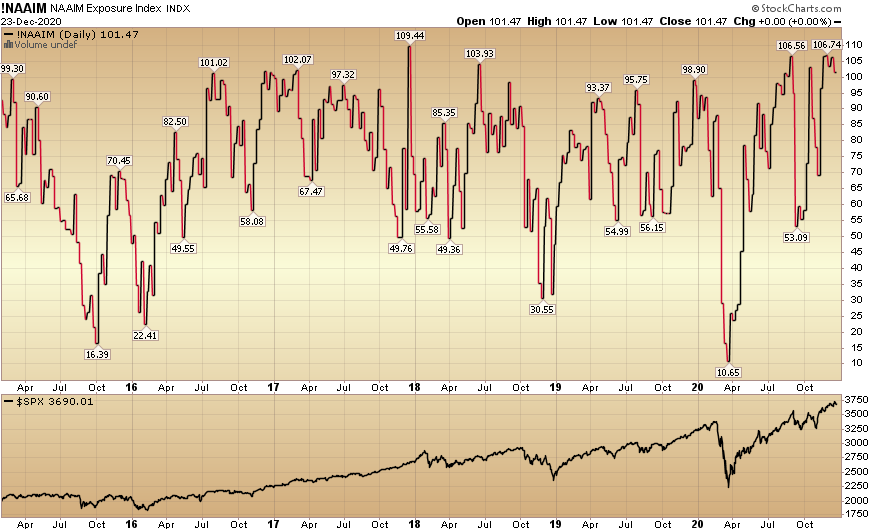
And finally, this week the NAAIM (National Association of Active Investment Managers Index) (Video Explanation) came down a nudge to 101.47% this week from 106.74% equity exposure last week. As we said before the election, managers would have to chase into year-end – and they are now doing just that. As you can see over the past five years, this level of “extreme” warrants caution but is not always indicative of a top.
(Click on image to enlarge)
Our message for this week:
Our view has stayed consistent...
“While the (short-term) “easy money” has been made in the general indices (since the March lows), I think the easy money is just getting started in “left for dead” sectors/stocks.I believe Banks, Defense Stocks and pockets of Energy will be as good – if not “orders of magnitude” better (in coming quarters) – than buying the general market in late March.”
While many worry that institutional managers – and retail investors alike – are overly confident, it just may be the case that we’ll get the anticipated correction when everyone has forgotten about the “euphoria” narrative. Sometimes “Confidence” is just what the doctor ordered at the beginning of a new cycle. This chart by J.C. Parets speaks exactly to the point we have been making in the last two notes.
While everyone’s looking for NOW, I think the odds favor a Q1 pullback – after most managers have given up on a correction and followed the chase. Only when everyone’s IN can they open the trap door…
That said, if you take a few steps back (like we covered two weeks ago), it may be too cute to try to play it – considering we have just started a new business cycle. There were fierce corrections in 2010 and 2011 after the huge move off the March 2009 lows.
It did not pay to play the short term moves in 2010 and 2011 – as you may very well have missed out on a decade long run. That long cycle ended with the 2019 yield curve inversion, and the 2020 ~35% correction plus 1H recession (2 quarters of negative GDP growth). The recession ended with positive GDP growth in Q3 2020 (33.4% annualized) and began the new business cycle.
We’ll be using any weakness that potentially comes our way in Q1 to add more value/cyclical names to hold for the next 3-5 years…
Disclaimer: Not investment advice. For educational purposes only: Learn more at HedgeFundTips.com.
less

