
The Rebalance Of Power: Tesla, Walmart, & Disney Join The S&P 500 ESG Index, Facebook, Wells Fargo, & Costco Dropped
ESG momentum shows no signs of stopping, with sustainable fund assets nearing USD 2 trillion, following record inflows in Q1.1 Pressure on firms to perform in sustainability rankings has never been higher, as Wall Street’s hottest topic gets hotter still. But what firms benefit from all this heat? From the assets flowing into S&P 500® ESG Index related products,2 it seems the balance of power may be shifting. At least for the foreseeable future, Sustainability is King (or Queen). So, by almost royal decree, here are the results of the 2021 S&P 500 ESG Index annual rebalance.
What’s changed? First, the methodology itself—with the introduction of a new thermal coal screen last September following public consultation. Even though the index still aims to offer a similar risk/return profile to the S&P 500, with sustainability enhancements—rather than reduce carbon exposure, per se – it experienced a welcome decrease of 12% in carbon intensity since the last annual rebalance.3
ADDITIONAL INDEX-LEVEL METRICS
A broader sustainability lens reveals that the index achieved an S&P DJI ESG Score improvement of 8% (at the index level), representing 23% of the overall ESG-improvement potential, given the sustainability characteristics of the starting universe.4 Within the underlying E, S, and G dimensions, the sustainable counterpart to the S&P 500 realizes numerous tangible enhancements, all while providing similarly broad U.S. equity exposure. Due to the depth and breadth of topics covered in the S&P Global Corporate Sustainability Assessment that underpins the S&P DJI ESG Scores, there are too many to demonstrate here, though a sample is provided in Exhibit 1. Such improvements are even more pronounced within industry groups, given the industry-specific nature of S&P DJI ESG Scores.5
(Click on image to enlarge)

CONSTITUENT SELECTION
What of the constituents? As of the 2021 rebalance, 315 constituents made it into the S&P 500 ESG Index, as 190 constituents were not included (79 were ineligible and 111 were eligible but not selected). As per the S&P 500 ESG Index methodology, companies might not qualify because they are: (a) ineligible according to certain ESG exclusionary criteria; or (b) simply not selected, even if they are eligible, because of poorer relative S&P DJI ESG Score performance than their index industry group peers. Exhibit 2 highlights how the S&P 500 translated into the composition of S&P 500 ESG Index in 2021.
(Click on image to enlarge)


As for major changes, Exhibit 3 highlights the biggest new additions and drops in terms of market capitalization. Other household names that made it into the sustainable index include Ford Motor Crop, News Corp, Marriott, and Etsy. Meanwhile, Lumen Technologies, L Brands, UDR, and Sealed Air Corp were among those that were removed despite being eligible, due to relatively poor S&P DJI ESG Score performance than their peers. Other names, such as Atmos Energy, Allegion, and Fortune Brands Home & Security were dropped because they fell to within the bottom 25% of S&P DJI ESG Score rankings among their global GICS industry group peers, rendering them ineligible. In addition, Johnson & Johnson, 3M, and Dupont remained on the exclusion list, as they have not yet completed the penalty period for their involvement in material public controversies.7
Interestingly, though the rebalance generates ample turnover, 74 constituents of the S&P 500 have consistently not met the rules-based selection criteria of the ESG index since it launched in January 2019 (see Exhibit 4). Conversely, 207 companies have managed to maintain their position in the sustainable index since its launch (see Exhibit 5).
(Click on image to enlarge)


RESULTS & PERFORMANCE
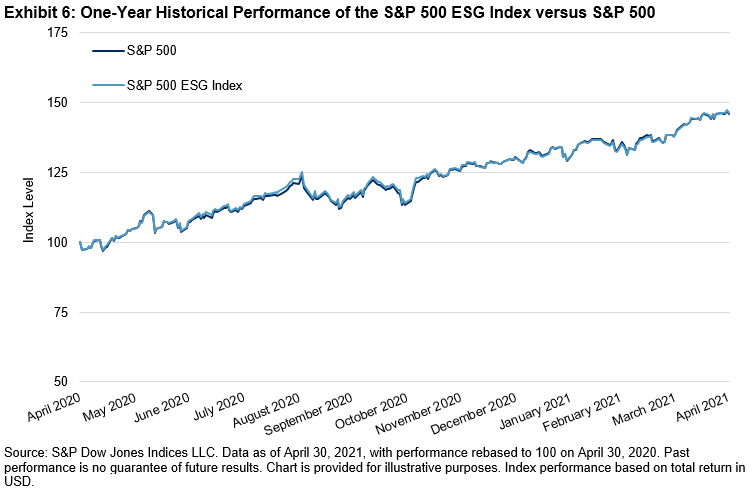
Despite containing just 75% of the S&P 500 market capitalization, the aforementioned sustainability improvements were achieved with only 1.11% of tracking error and excess returns of 0.67% over the past five years—in part, helping to dispel the myth of an inherent sustainability versus performance tradeoff. However, since the five-year return includes back-tested history that was built before the index was launched, it is worth paying special attention to the live performance record over the past year, when it exhibited excess returns of 0.42% and 1.83% of tracking error (see Exhibit 6).
(Click on image to enlarge)
But can this outperformance be explained away by other factors?
PERFORMANCE ATTRIBUTION: A STORY OF SELECTION
Performance attribution primarily reveals a story of selection. It was generally because of the stocks selected according to their sustainability credentials, rather than differences in sector exposure, that appear to have driven this excess return. Indeed, this should come as no surprise, as the methodology lends itself by design to a broadly sector-neutral outcome. Thus, the outperformance was not all necessarily due to significant overexposure to Tech and underexposure to Energy, as many might assume.
(Click on image to enlarge)

FACTOR EXPOSURE: SPOT THE DIFFERENCE
A closer look at the underlying factor exposure also reveals that the factor tilts are in fact quite similar to the S&P 500, save for a minor discrepancy in its exposure to larger firms.9 These similarities are consistent with the ESG index’s objective to provide a similar level of risk and return. As such, the absence of any sizeable unintended factor exposure cannot entirely explain this difference either—suggesting other “forces” are still potentially at work.
(Click on image to enlarge)

CONCLUSION
Though the aim of the S&P 500 ESG Index is not to outperform but provide exposure and performance broadly in line with the benchmark, these results show that a rules-based selection process, driven by ESG principles, has yielded greater exposure to high-performing companies. And so, without other explanatory challengers to usurp the performance throne, long may the reign of our sustainability monarch continue.
APPENDIX A
(Click on image to enlarge)

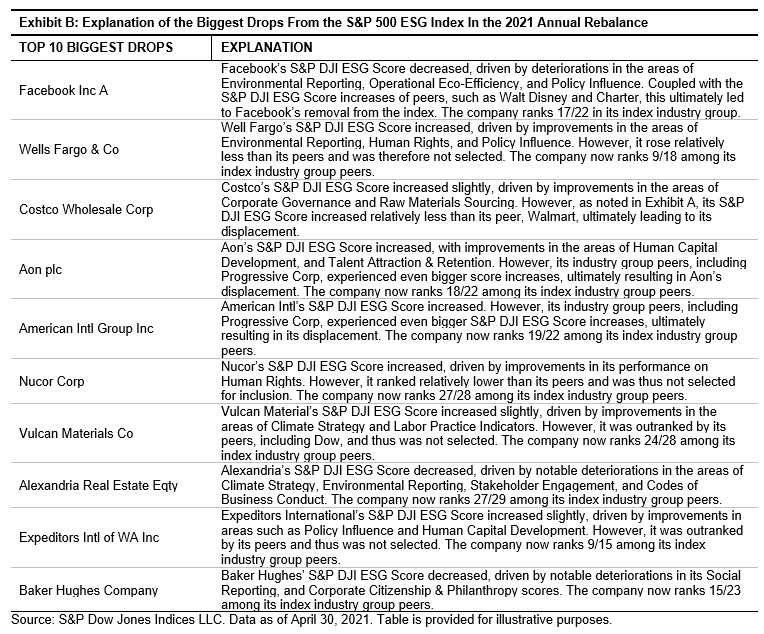
APPENDIX B
(Click on image to enlarge)
Disclaimer: Copyright © 2021 S&P Dow Jones Indices LLC, a division of S&P Global. All rights reserved. This material is reproduced with the prior written consent of S&P DJI. Please ...
more

