
The Reasons For The Rally
![]()
The State of the Market
To review, the overriding purpose of my oftentimes meandering morning market missive is to identify the primary drivers of the market action. As I've stated a time or two, my thinking is that if I can understand why Ms. Market is doing what she's doing on a day-to-day basis, I "shouldn't" get fooled by what happens in the longer-run.
So, while you can certainly file this in the Captain Obvious category, the current narrative in the market is stocks are continuing to discount the coming end of the COVID crisis via the broad distribution of two or three highly effective vaccines within the next six months. As such, analysts are busy putting a pencil to what the economy will look like when social distancing is no longer required, and, in turn the anticipated improvement to corporate earnings.
Below is a visual representation of what is happening to earnings estimates for the S&P 500. The light blue dashed line - or the line with the big drop on the chart - is the consensus estimate for operating earnings for calendar year 2020, while the orange dashed line represents estimates for 2021.
S&P 500 Operating EPS Projections By Calendar Year
(Click on image to enlarge)
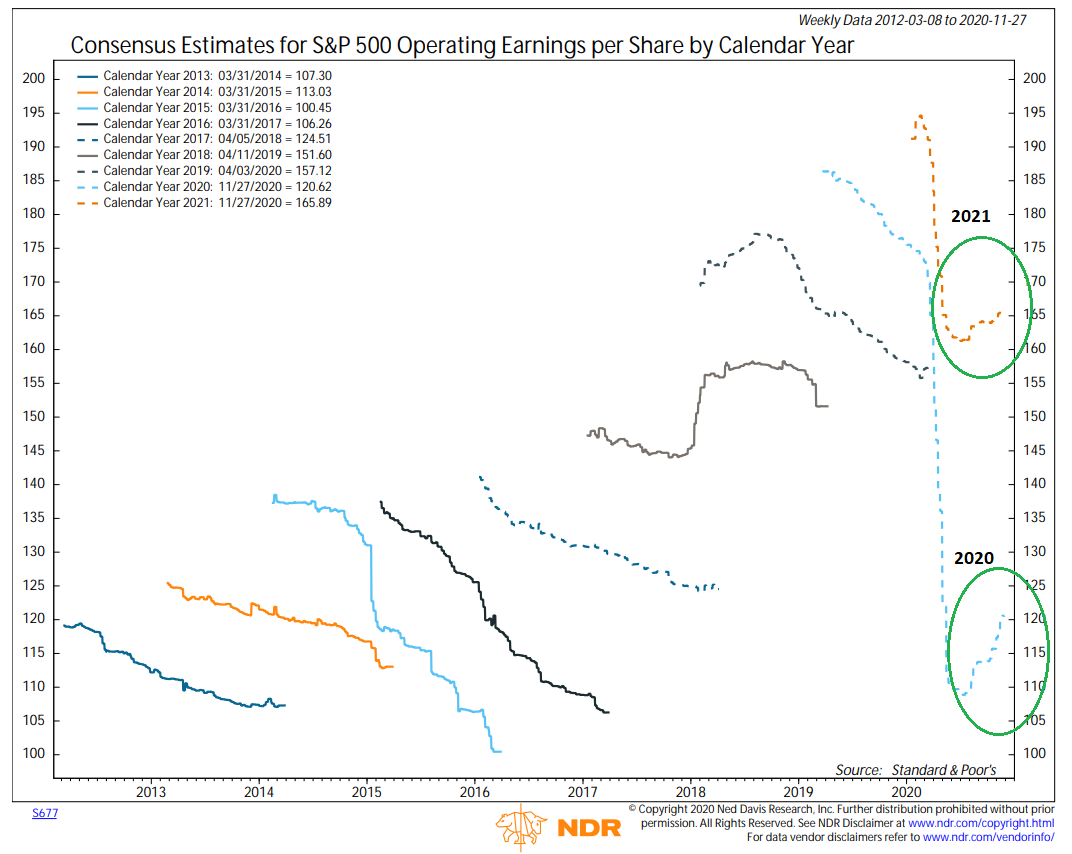
Source: Ned Davis Research Group
As you can see on the chart, earnings estimates are "movin' on up" these days, which is a good thing for stock prices. And I will note that 2021 estimates are now above where 2019 ended. Therefore, from a simplistic point of view, it makes sense that stock prices are now higher than where they were at the end of 2019.
Yes, we can argue for days as to the appropriate price level for the indices relative to earnings over specific time frames. But at this point in time, the game is about the direction things are moving. Oh, and the expectation that there is likely to be significant pent up demand for all kinds of economic activity.
On that note, some analysts have gone so far as to say that the end of COVID could usher in this century's version of the "Roaring Twenties." One can hope, right?
While I'm not sure I can jump on the "happy days are here again" bandwagon just yet, I do understand that hope and expectations for improved economic activity is the name of the game right now.
Yet, at the same time, we must also remember that Wall Street tends to overdo things at every turn. So, with stocks in an overbought condition and sentiment currently in a ultra-rosy state, we need to be prepared for some sort of pullback or pause in the action (presumably after some additional upside). As such, my current plan (which feels a little to popular right now and can always change with conditions) is to use any/all weakness to put new money to work in portfolio strategies.
The State of the Trend Indicators
The Trend Board remains in good shape here. And this morning's rally has actually pushed the short-term Channel System into the green. In short, there's nothing to complain about as the most bullish thing a market can do is make new highs. 'Nuf said.
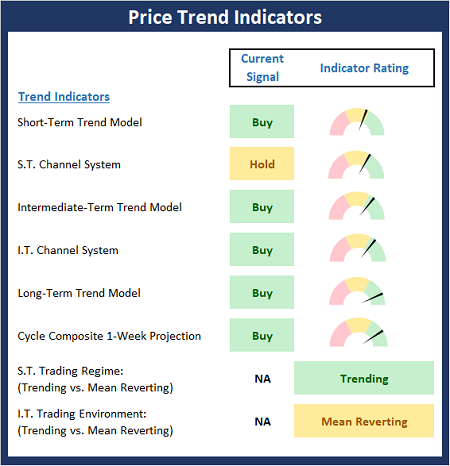
About The Trend Board Indicators: The models/indicators on the Trend Board are designed to determine the overall technical health of the current stock market trend in terms of the short- and intermediate-term time frames.
My Take on the State of the Charts...
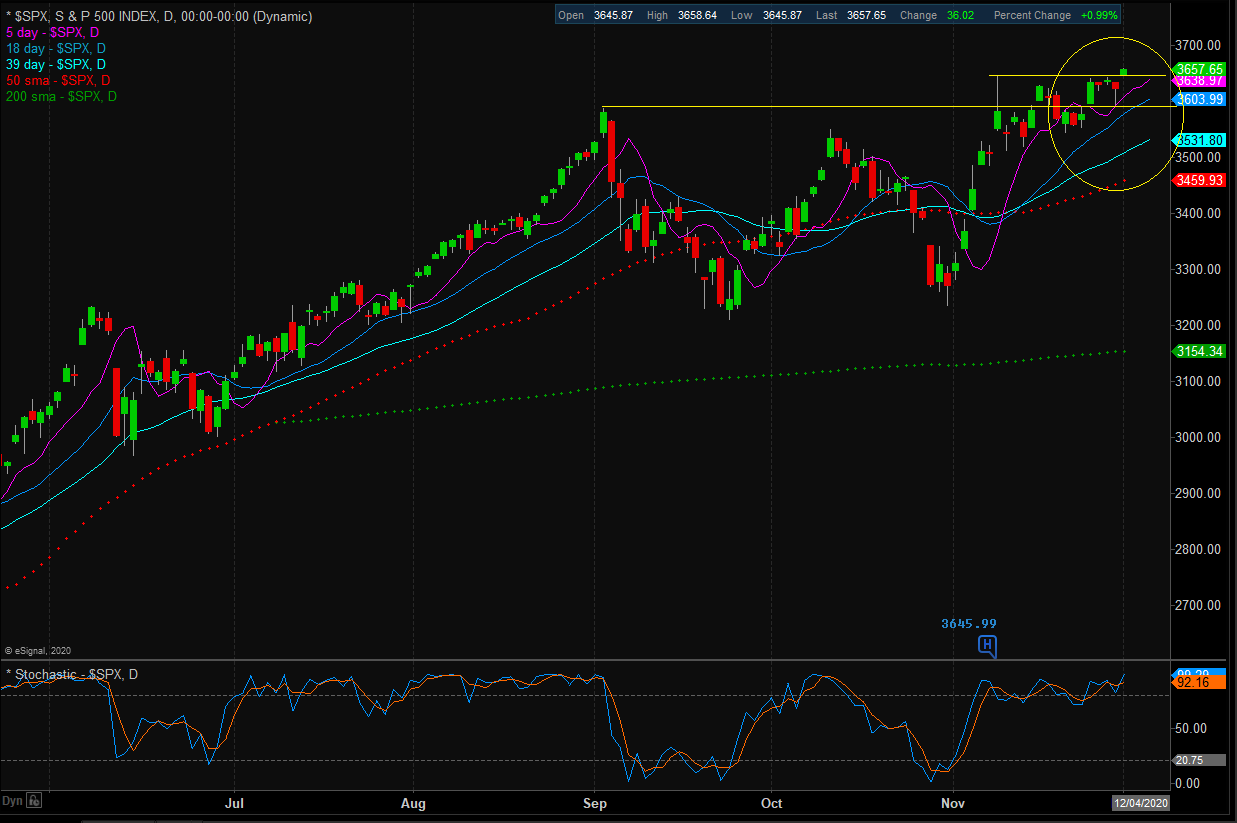
For the last couple of weeks, the question of the day was if the S&P 500 was "breaking out" of the sideways trading range that had been in place since early September. After initially breaking above the upper end of the range in early November, the venerable blue-chip index proceeded to waffle sideways for several days, putting the "breakout" in question. The good news is that this morning's rally appears to have put the question to bed. So, unless the bears can put in a quick stop here, it looks like the next leg higher has officially begun.
S&P 500 - Daily
(Click on image to enlarge)
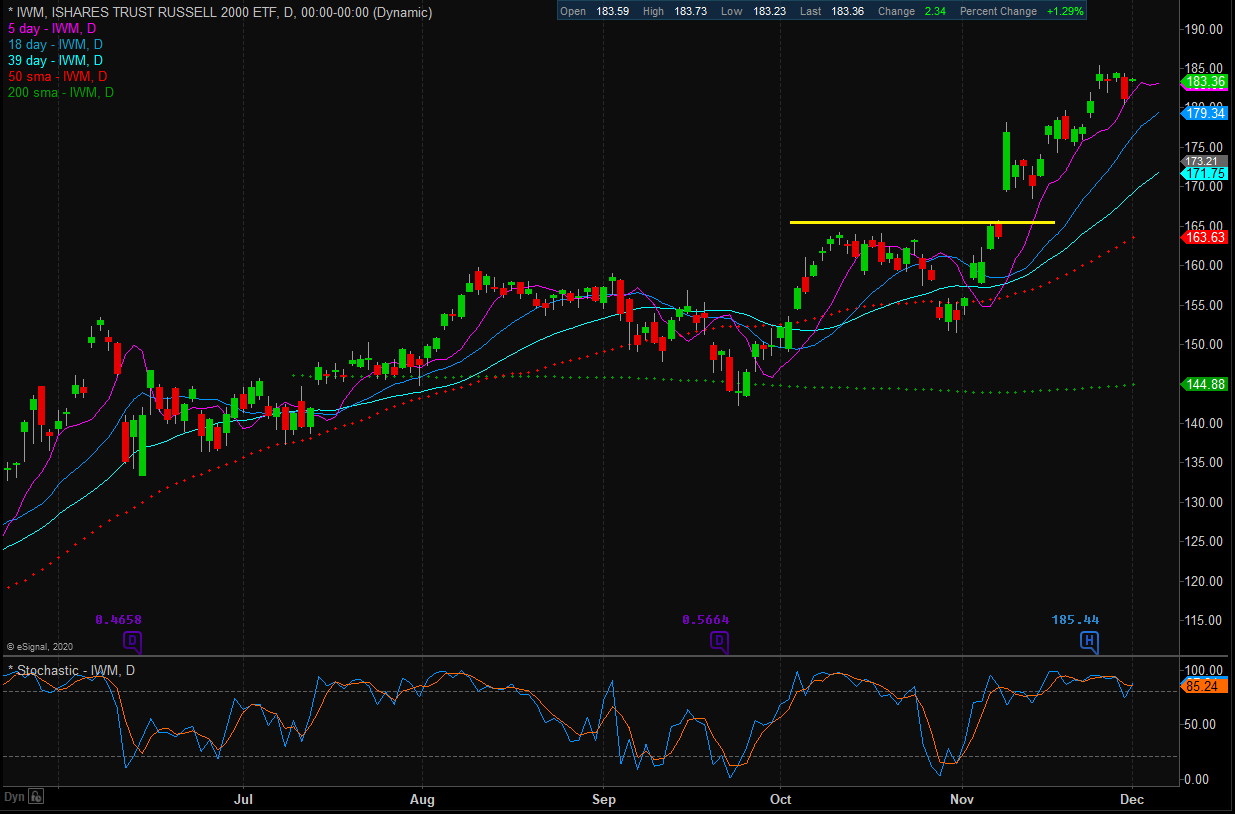
Below is a chart of the Russell 2000 ETF (IWM), which is considered to be the primary proxy for the action in the small-cap space. As I opined last week, this chart has clearly broken out of its recent trading range is currently in an uptrend. As you will recall, I viewed this action as a "tell" for which way the large-cap indices would eventually go. (You've got to love it when a plan comes together.) So, I for one will be watching the small-caps for signs that the rally may need to rest a spell. And as long as the IWM can follow along with the S&P and make a new high, all systems are go (for now).
Russell 2000 Small-cap ETF (IWM) - Daily
(Click on image to enlarge)
Next, let's check in on the state of the market's internal momentum indicators.
The Momentum board continues to confirm the price action, which is a desired result. In addition, I would expect the Short-Term Trend & Breadth Confirm Model to flip to positive if today's early rally holds. And with the hypothetical average return of the market based on the current readings of the models more than double the historical average, the odds continue to favor the bulls.
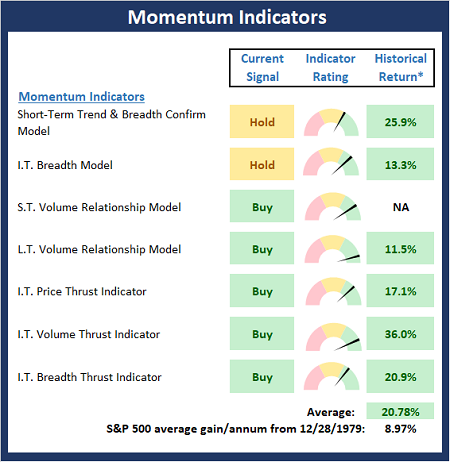
* Source: Ned Davis Research (NDR) as of the date of publication. Historical returns are hypothetical average annual performances calculated by NDR.
The opinions and forecasts expressed herein are those of Mr. David Moenning and may not actually come to pass. Mr. Moenning's opinions and viewpoints regarding the future of the markets should ...
more

