
The Real Black Swan
The Nasdaq crashed 13% from February 24-28. The three-month crash into late December 2018 was 20%+, but not this sharp. This crash is now the fastest in one week following a new high in stocks.
The coronavirus is what I call a real “black swan”. Something that comes out of the left field and is different enough from past such pandemics; not as predictable, and we don’t have proven vaccines, and it will take too long to get them developed and approved as it currently stands.
The markets on crack ignored it at first, as they did the Iran standoff. But then when the coronavirus hit a western country, Italy, and started popping up in many places… that is the definition of the early stages of a pandemic.
It has been contained substantially in China and Asia, but warmer weather was working in those countries’ favors. In Europe and the U.S., we are in the late stages of winter and that helps the virus expand.
The Fed has already cut rates 0.5% and other central banks are doing the same this week – and higher QE is likely, as we will monitor. The Fed already went full bore back into money printing in mid-September due to the repo crisis, now the coronavirus crisis gives it the excuse to keep going.
As this chart shows, stocks have gone straight up in response on about a 2.5-week lag.
(Click on image to enlarge)
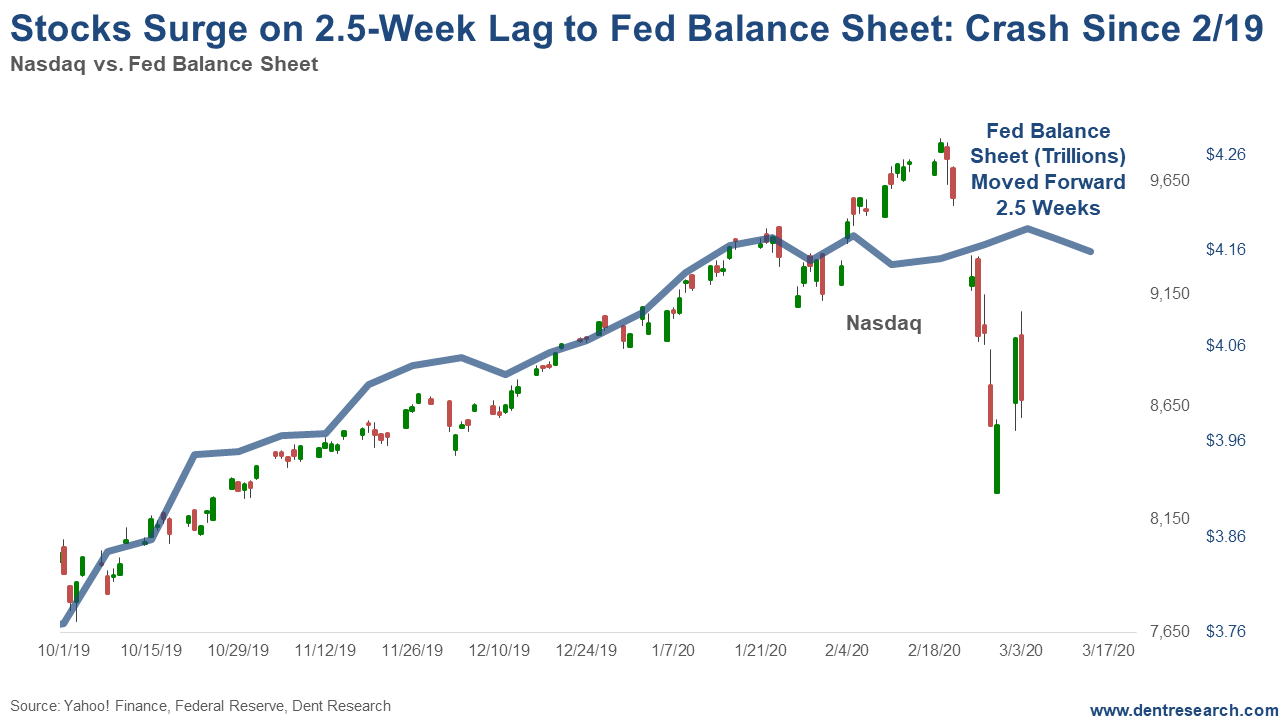
The first surge was directly in line into the January 24 top. But Repo funding has naturally dropped off, while the Fed kept goosing QE both to make sure the repo crisis doesn’t come back and now to cushion the potential coronavirus pandemic.
We were still at the high side of this correlation when stocks suddenly crashed on February 24-28. This crash has gotten stocks very undervalued versus this chart.
Stocks continued their rally since Friday’s bottom into early Tuesday, but then reversed back downwards by about 3%. But stocks have rallied back sharply erasing most of those losses on the strong Biden wins on Super Tuesday.
This pullback is normal thus far, but much lower and we could retest the lows on February 28, or go a bit lower.
The odds favor a V-shaped rebound if there are no serious signs of the virus continuing to mushroom ahead. That could actually take the Nasdaq to new highs of 10,000+ by late April or early May, and possibly sooner.
But I also think there is a strong chance that such a new high would not be confirmed by other major indices. That would suggest a major top and would be very similar to the August to October topping scenario for the 2007 top with such divergences. A bump up in QE this week or next would only further favor this scenario.
But if we get more of a dead cat bounce the next few weeks, back to no higher than 9,200 or so at best, and markets move sideways for weeks or head sharply back down… then the odds grow that we’ve already seen a top.
Again, even a retest of the lows on Friday, February 28, or slight new lows near term would not invalidate this final V-shaped rally scenario.
If stocks do turn down more strongly with exploding bad news, then the next strong support would be the bottom trendlines for the entire bubble since 2009. That would hit around 2,550-2600 for the S&P 500 and 6,000-6,200 for the Nasdaq, which would strongly suggest this bubble is over. There would then be a several-month bear market bounce into the election before the long fall into around late 2022 down 80%+.
Follow me on Twitter @harrydentjr


