
The Nasdaq 100 – Russell 2000 Roller Coaster Rolls On
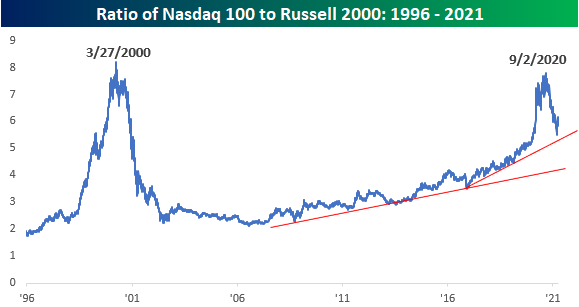
Looking at the relationship between the largest of the large (Nasdaq 100) and the smallest of the small (Russell 2000) over the last 25 years, we can’t help but think of an old-time roller coaster with steep inclines and declines along the way. The runup of the Nasdaq 100 relative to the Russell 2000 in the late 1990s that peaked in March 2000 was nearly vertical, and the decline from that peak was just as steep. Once things bottomed out for the Nasdaq 100 in mid-2006, it embarked on a steady period of outperformance that started to accelerate in early 2016 and then really took off with the COVID outbreak in early 2020. Then in early September of last year, the Nasdaq 100’s relative strength peaked with the onset of the ‘big shift’. In the months following the Nasdaq 100’s relative peak in early September, the index saw its largest margin of underperformance relative to the Russell 2000 since the bursting of the Dot Com bubble.
The chart below takes a more detailed look at the ratio between the two indices going back to just 2017. While the Nasdaq 100’s recent underperformance relative to the Russell 2000 has been sharp, it wasn’t nearly as steep as its vertical outperformance at the onset of COVID. In recent weeks, the Nasdaq 100 has seen a sharp rebound on both an absolute and relative basis. Since March 12th, the Nasdaq 100 is up over 5% while the Russell 2000 is down over 5%. What’s noteworthy about this bounce is that it occurred just above the uptrend line from the early 2016 lows and nearly at the exact same spot as the ratio was at the start of February 2020 when the pandemic was just getting ready to explode.

Click here to view Bespoke’s premium membership options for our best research and market analysis ...
more

