
The Lines In The Sand Are Clear
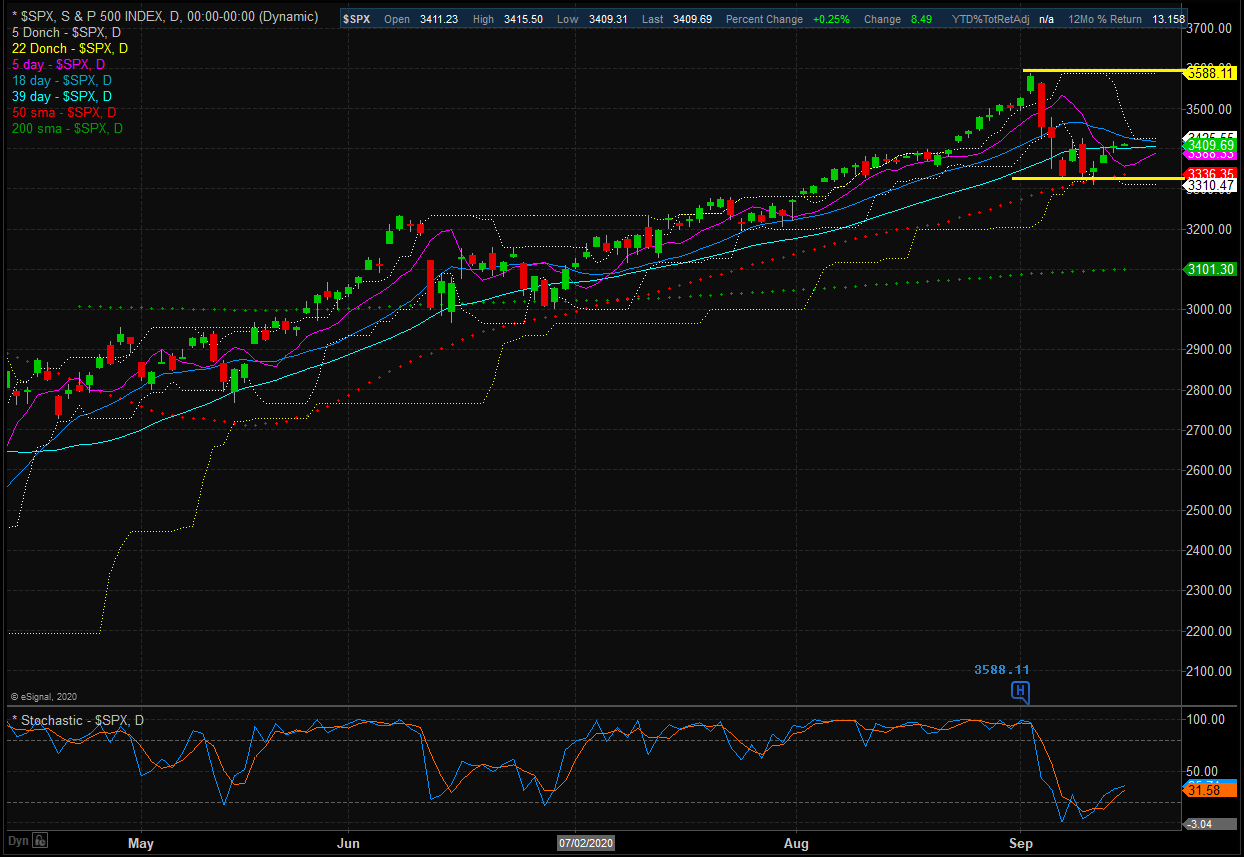
The good news is the bulls have been able to hold the line at key support levels (think 50-day moving averages) across the board on the major stock market indices. The bad news is the recent rebound hasn't reversed the trend or moved the bulls completely out of harm's way. As such, my take is that the battle lines have been drawn for the two teams to fight over in the weeks ahead. The bottom line is the bulls need a breakout above the 3589 level on a closing basis on the S&P 500 cash index while the bears are hoping for a break down below 3310. And everything in between can be viewed as basically "noise".
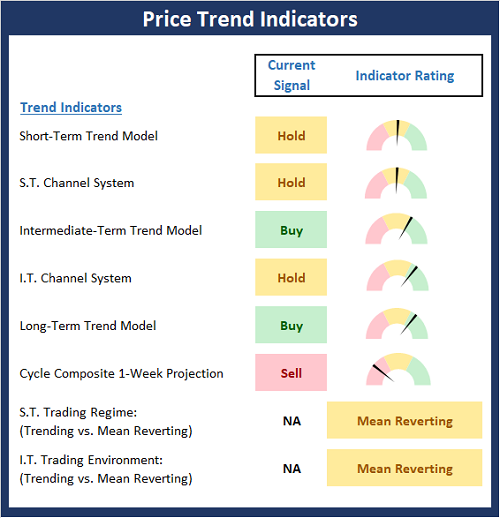
The State of the Trend Indicators
While still far from positive, the Trend Board has definitely perked up a bit over the past week. Neutral "hold" signals have replaced the "sells" from a week ago in both the Short-Term Trend and Channel Systems. And while the Intermediate-Term Channel System ticked down to neutral from positive, the board now sports a largely neutral position. From my seat, this means you can hold current long positions until/unless the bears can produce (and hold) a meaningful break below the recent lows.
* Source: Ned Davis Research (NDR) as of the date of publication. Historical returns are hypothetical average annual performances calculated by NDR. Past performances do not guarantee future results or profitability - NOT INDIVIDUAL INVESTMENT ADVICE.
About The Trend Board Indicators: The models/indicators on the Trend Board are designed to determine the overall technical health of the current stock market trend in terms of the short- and intermediate-term time frames.
My Take on the State of the Charts...
The "test" of the recent support zones has been successful so far. However, the bulls will want to put some distance between here and the lows (and avoid additional downside testing) as the old saw says that the more a zone is tested, the weaker it becomes. So, if the bulls can continue movin' on up and make an effort to start testing the upper lines in the sand (i.e. key resistance), we'd consider that bullish action. However, if the current rebound begins to stall, then we should probably expect some additional downside price exploration. Oh, and plenty of volatile back-and-forth action in between - that's just how the game is played these days.
S&P 500 - Daily
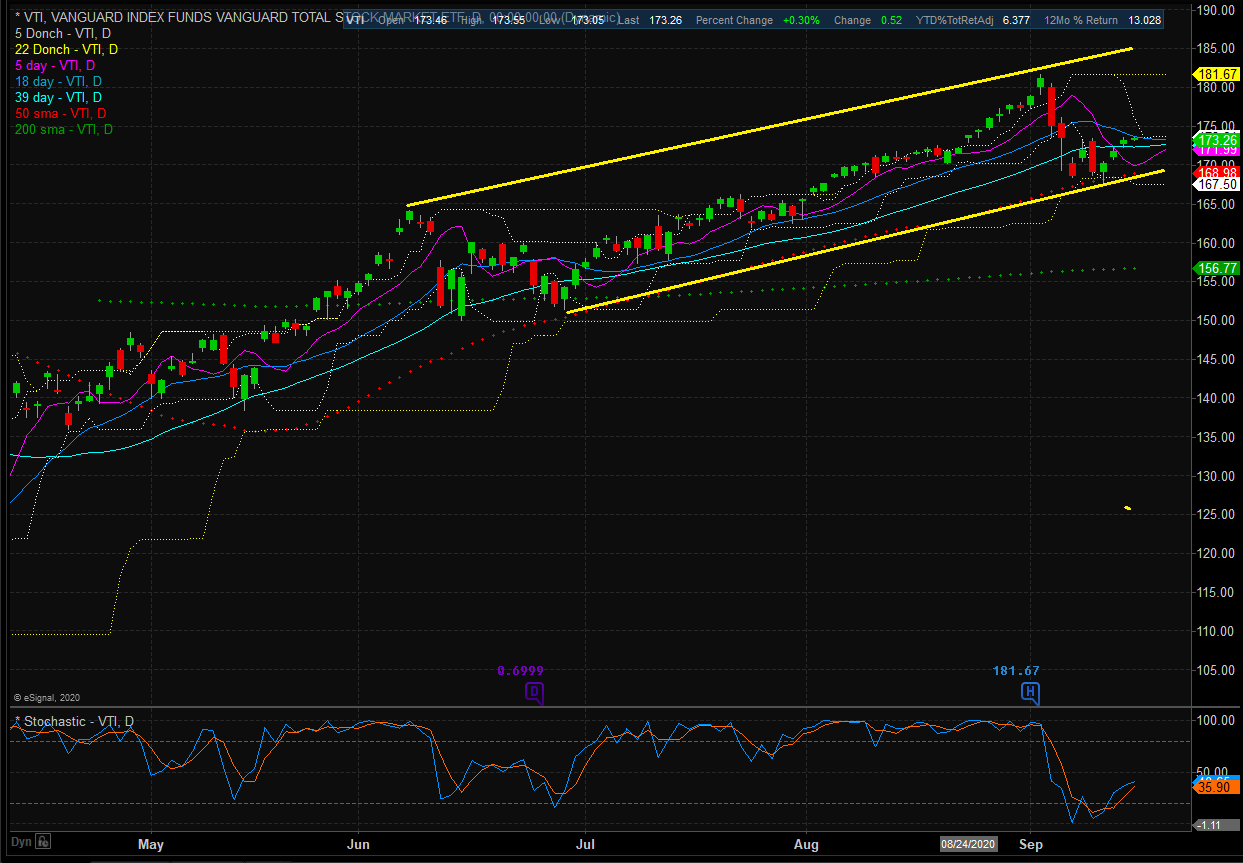
One of the complaints in the market has been the concentration in the megacap leaders. I think it is important to note that (a) this type of condition is fairly typical at times (especially in a global pandemic that is producing clear winners that are growing and gaining market share) and (b) that this can last for some time. However, in looking at the "total market" index (Vanguard's Total Stock Market Index ETF - VTI) one can argue the broad market is "doing just fine, thank you." Yes, VTI is cap-weighted so it winds up being drawn toward the large-cap blend quadrant of the style boxes. And yes, VTI does hold a healthy chunk of the FANG's - albeit in smaller doses than the SPY and/or QQQ. But from my seat, the fact that the this "core" ETF remains in an uptrend suggests that the bulls are still in control of the game from a big-picture standpoint.
Vanguard Total Stock Market - Daily
(Click on image to enlarge)
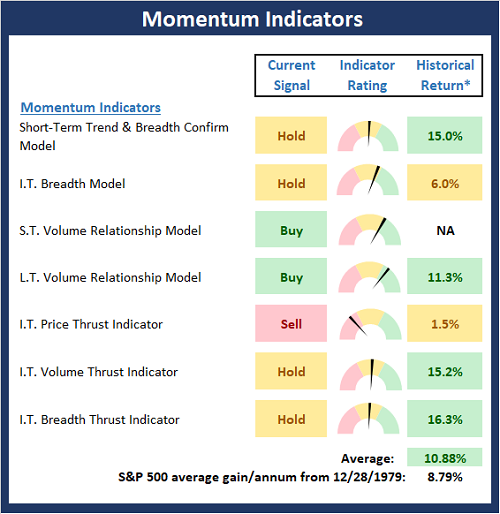
Next, let's check in on the state of the market's internal momentum indicators.
* Source: Ned Davis Research (NDR) as of the date of publication. Historical returns are hypothetical average annual performances calculated by NDR. Past performances do not guarantee future results or profitability - NOT INDIVIDUAL INVESTMENT ADVICE.
I've always believed that momentum is "where the rubber meets the road" in terms of the true state of the market. Thus, it is modestly positive that the Momentum Board has replaced a couple sell signals with hold signals this week. And while the board looks to be neutral overall, the hypothetical historical return of the S&P 500 with the momentum models in their current state has moved up from 1.36% per annum last week to 10.88% this week. In my book, this is a meaningful improvement and suggests that we continue to give the bulls the benefit of any doubt here.
So, given that the S&P has already experienced what amounts to a "garden variety" correction (a pullback in the -5% to -10% range, this one has been about -7% so far), it might be best to remain optimistic unless/until the bears can produce a break below those lines in the sand.
My view is that if the bears can find a reason to break through to the downside, we could easily see some additional scary downside action, which would likely be one-directional and violent. But until then, I think it is best to look on the bright side and give the bulls a chance.
The opinions and forecasts expressed herein are those of Mr. David Moenning and may not actually come to pass. Mr. Moenning's opinions and viewpoints regarding the future of the markets should ...
more

