
The Latest On Apple
Apple Inc. (AAPL) is engaged in designing, manufacturing and marketing mobile communication and media devices, personal computers, and portable digital music players. The Company's products and services include iPhone, iPad, Mac, iPod, Apple TV, a portfolio of consumer and professional software applications, the iOS and Mac OS X operating systems, iCloud, and a range of accessory, service and support offerings. It sells its products worldwide through its online stores, its retail stores, its direct sales force, third-party wholesalers, and resellers. Apple Inc. is headquartered in Cupertino, California.
As every good "fanboy" knows, today was the day for Apple's World-Wide Developers' Conference (WWDC). This event is special because the tech giant presents new features, apps, operating systems to the developers who work to make software for Apple hardware.
The company has made a series of announcements for new software, including iOS12 for portable devices like iPads and iPhones and macOS10.14 for the firm's computers. They also announced improvements for apps like the Siri personal assistant, better management for notification features, and improvements to the FaceTime video calling system.
It will take a few days for all of the new features, software, and apps to be analyzed by power users, developers, bloggers, and others. But, in the past, it has been a bad idea to bet against this company. No matter the problems along the way, the Apple user base has shown a remarkable capacity for forgiveness and an ability to overcome a variety of problems with Apple software and hardware.
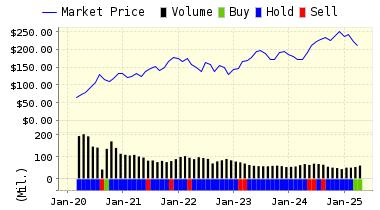
We have typically had a BUY on this company for the past few years, and today is no different. We continue its BUY recommendation on APPLE INC for 2018-06-01. Based on the information we have gathered and our resulting research, we feel that APPLE INC has the probability to OUTPERFORM average market performance for the next year. The company exhibits ATTRACTIVE Company Size and Sharpe Ratio.
|
ValuEngine Forecast |
||
|
Target |
Expected |
|
|---|---|---|
|
1-Month |
191.12 | 0.46% |
|
3-Month |
192.54 | 1.21% |
|
6-Month |
197.14 | 3.63% |
|
1-Year |
200.84 | 5.57% |
|
2-Year |
220.69 | 16.01% |
|
3-Year |
231.37 | 21.62% |
|
Valuation & Rankings |
|||
|
Valuation |
11.47% overvalued |
Valuation Rank |
|
|
1-M Forecast Return |
0.46% |
1-M Forecast Return Rank |
|
|
12-M Return |
24.19% |
Momentum Rank |
|
|
Sharpe Ratio |
0.91 |
Sharpe Ratio Rank |
|
|
5-Y Avg Annual Return |
21.35% |
5-Y Avg Annual Rtn Rank |
|
|
Volatility |
23.37% |
Volatility Rank |
|
|
Expected EPS Growth |
16.31% |
EPS Growth Rank |
|
|
Market Cap (billions) |
1,108.10 |
Size Rank |
|
|
Trailing P/E Ratio |
17.77 |
Trailing P/E Rank |
|
|
Forward P/E Ratio |
15.28 |
Forward P/E Ratio Rank |
|
|
PEG Ratio |
1.09 |
PEG Ratio Rank |
|
|
Price/Sales |
4.48 |
Price/Sales Rank |
|
|
Market/Book |
8.73 |
Market/Book Rank |
|
|
Beta |
1.27 |
Beta Rank |
|
|
Alpha |
0.06 |
Alpha Rank |
|
Disclosure: None.


