
The Goldilocks Warning
Market Review & Recap
Over the last couple of weeks we discussed the “wild swings” in the market in terms of price movements from overbought, to oversold, and now back again. The quote below is from two weeks ago but is apropos again this week.
“Despite the underlying economic and fundamental data, the markets have surged back to extremely overbought, extended, and deviated levels.On virtually every measure, markets are suggesting the fuel for an additional leg higher in assets prices is extremely limited.”
Just for visual's sake, the chart below compares the last three weeks of wild gyrations. (Click To Enlarge)
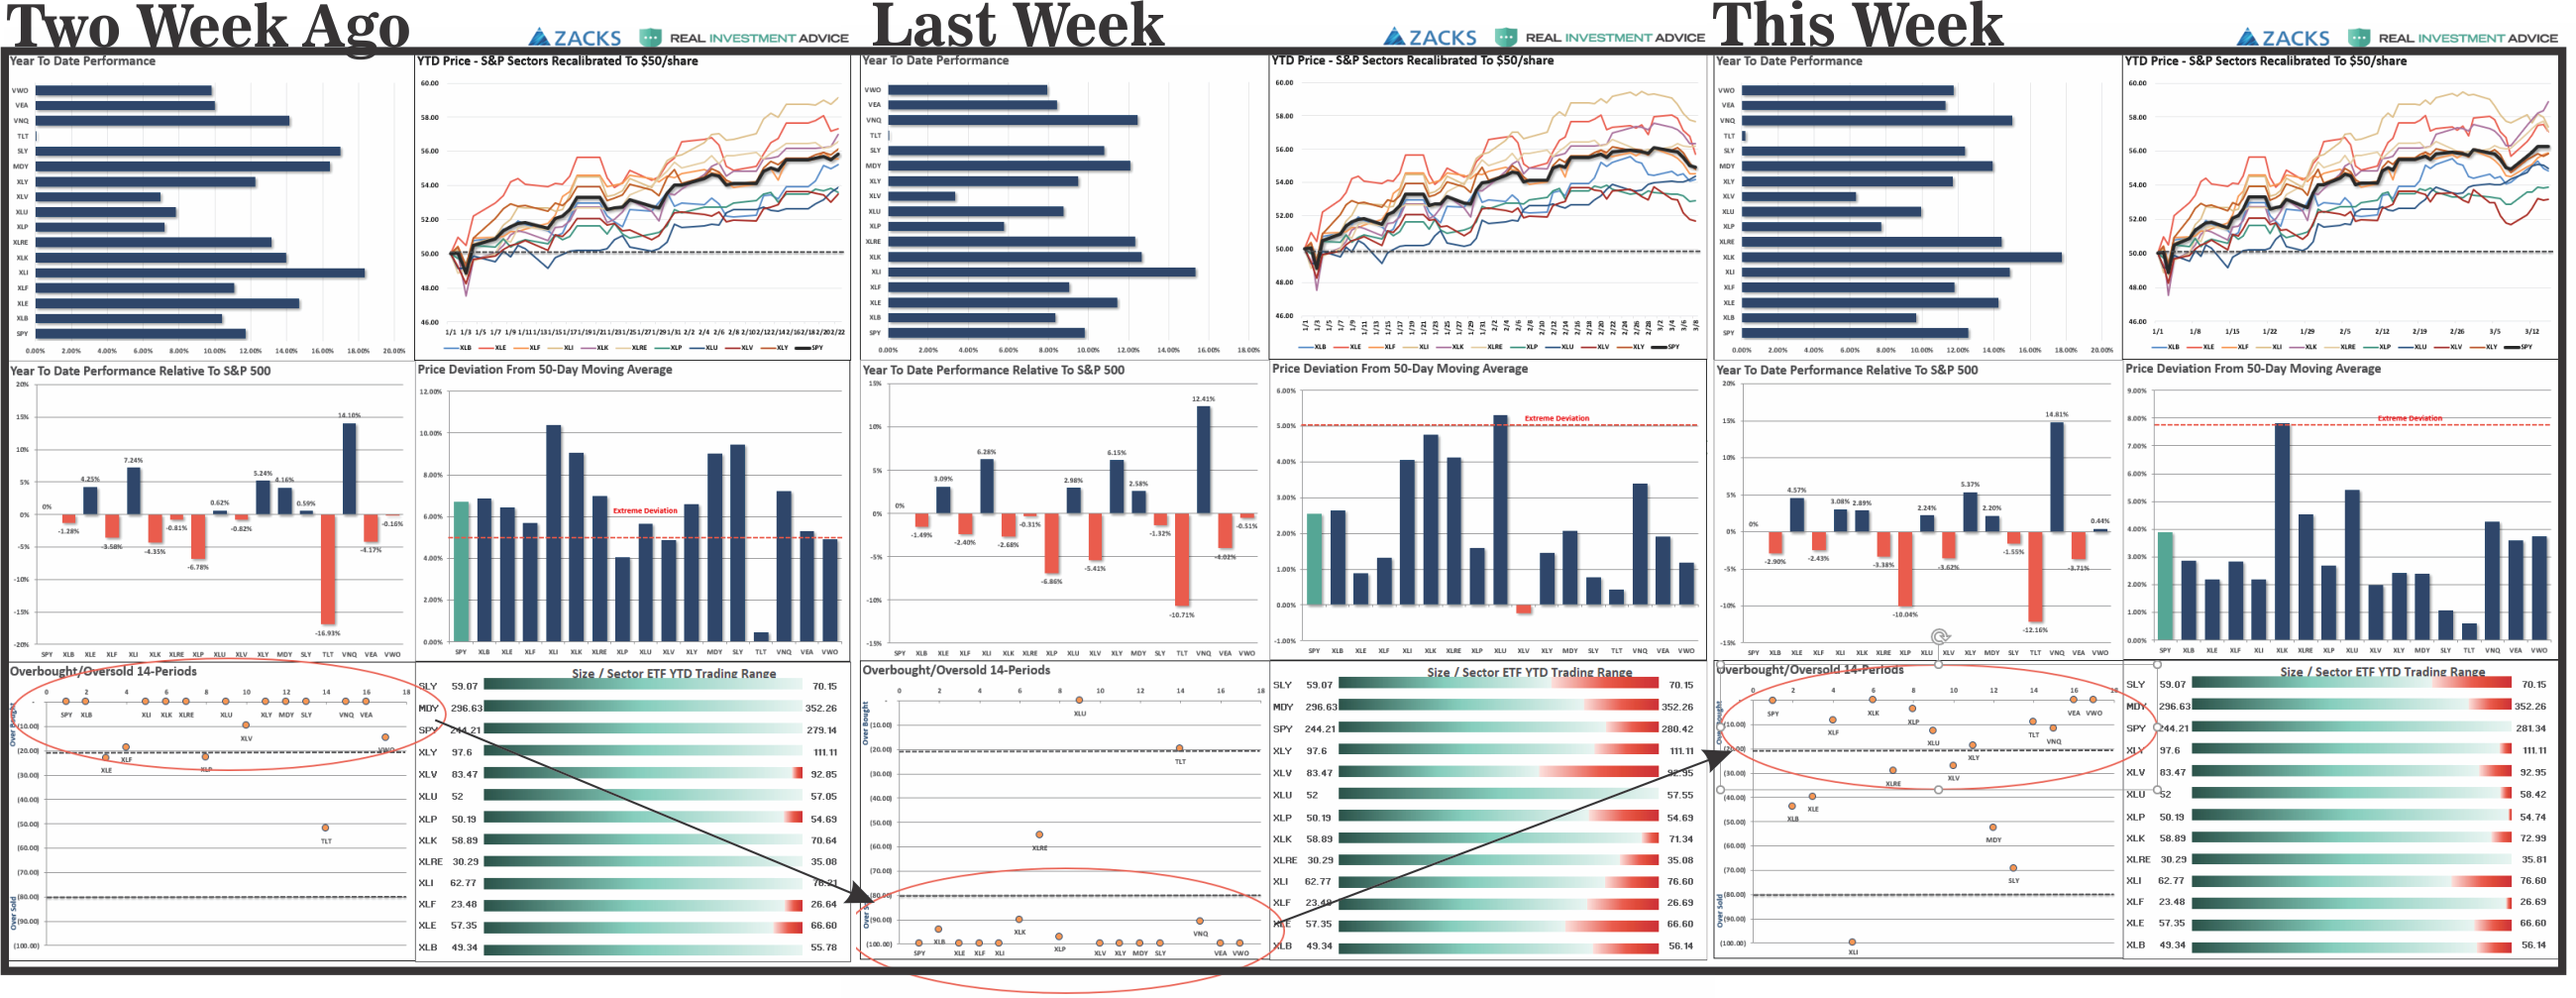
The chart below also shows the short-term reversal of the market as well. Note how in just a few days the market went from overbought, to oversold, back to overbought.
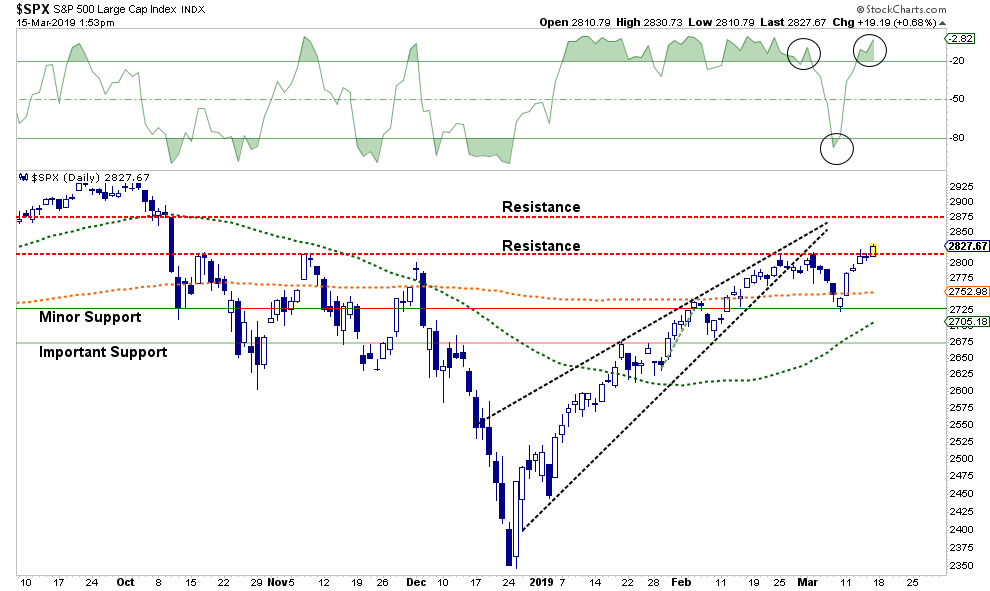
Importantly, as I specifically noted last week:
“This short-term oversold condition, and holding of minor support, does set the market up for a bounce next week which could get the market back above the 200-dma. The challenge, at least in the short-term, remains the resistance level building at 2800.”
On that analysis, we did increase equity exposure early last week in both our ETF and Equity Portfolios. In the RIA PRO version of this letter we gave specific recommendations to add exposure particularly to Healthcare due to the recent sell-off over concerns of “Medicare for all.”
Despite the rally, the bounce is still largely at risk for the three following reasons:
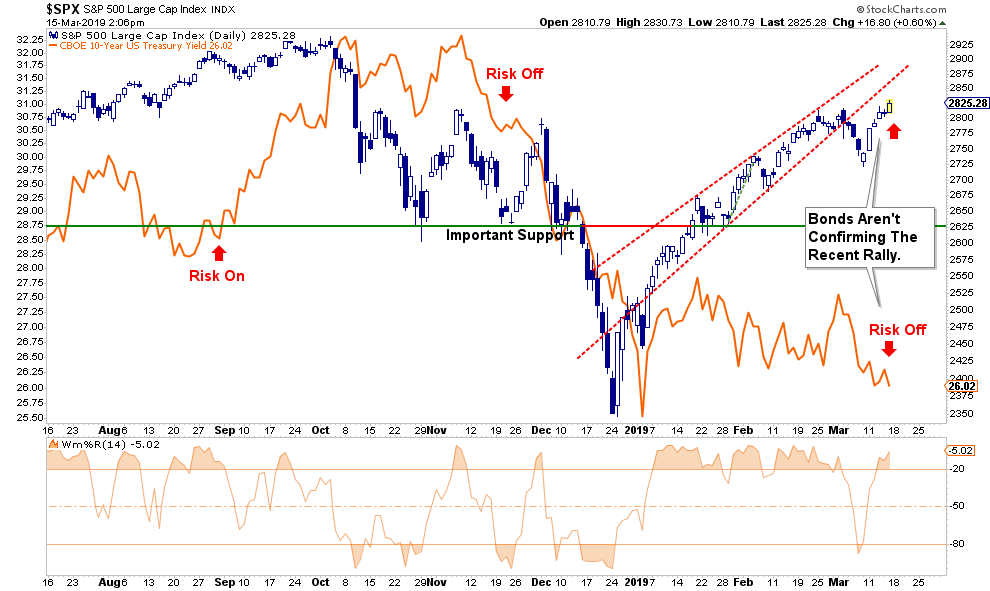
- As noted previously, the market has not reversed to levels which normally signals short-term bottoms. The red lines in the bottom four panels denote periods where taking profits, and reducing risk, has been ideal. The green lines have been prime opportunities to increase exposure. As you will note, these indicators tend to swing from extremes and once a correction process has started it is usually not completed until the lower bound is reached.
Important Note: This does not mean the market will decline sharply in price. The current overbought conditions can also be resolved by continued consolidation within a range as we have seen over the last two weeks.
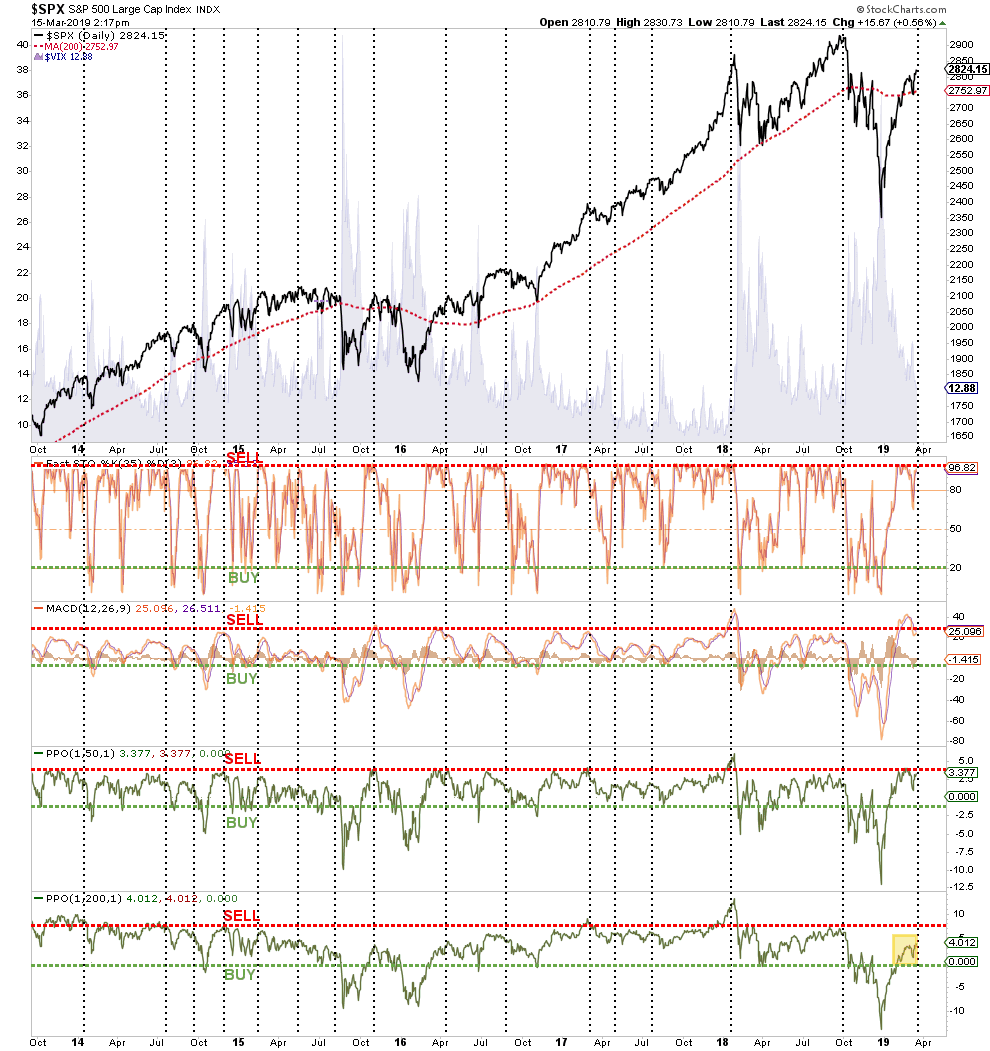
2) The divergence between stocks and bonds still signals that “smart money” continues to seek “safety” over “risk.” Historically, these bond market generally has it right.
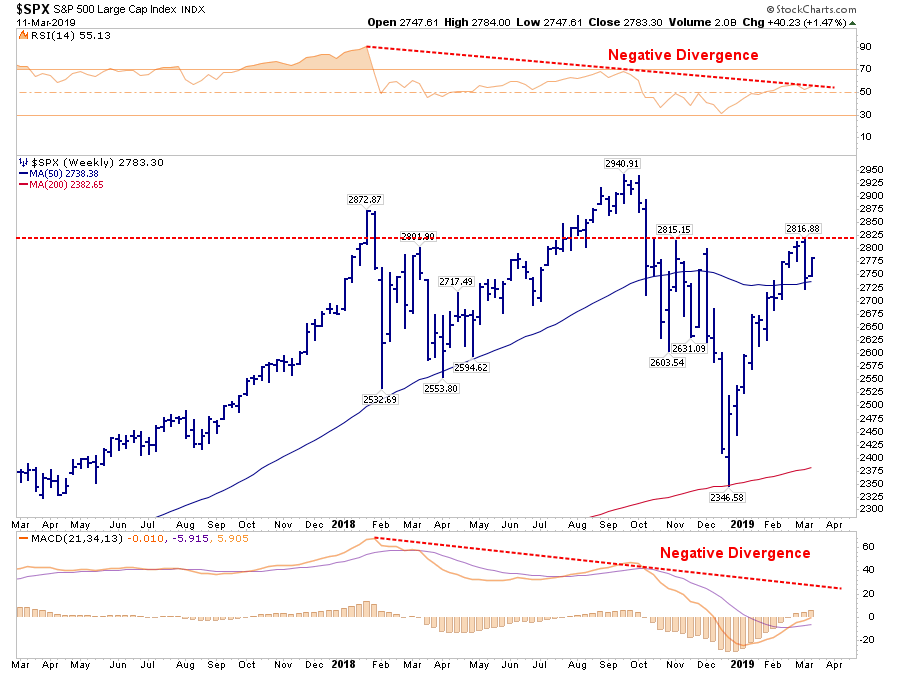
3) As discussed in “Will The Next Decade Be As Good As The Last,” the weekly chart below shows the S&P 500 hitting an all-time high last September before falling nearly 20% into the end of 2018. While the first two months of 2019 has seen an impressive surge back to its November highs, the market is starting to build a pattern of lower highs, and lower bottoms. More importantly, both relative strength and the MACD indicators are trending lower and negatively diverging from the markets price action.
As John Murphy noted last week for StockCharts:
- The bull market that ended in March 2000 preceded an economic downturn by a year.
- The October 2007 stock market peak preceded the December economic peak by two months.
- The March 2009 stock upturn led the June economic upturn by three months.
- Historically, stocks usually peak from six to nine months ahead of the economy. Which is why we look for possible stock market peaks to alert us to potential peaks in the economy that usually follow. And we may be looking at one.
If you are a longer-term investor, these issues should be weighted into your investment strategy. While we did add exposure to our portfolios early last week, we are still overweight cash and fixed income.
- In the RIA PRO Equity Model – we bought Boeing (BA) on the initial plunge,, and added positions in JPM, AAPL and PPL.
- In the RIA PRO ETF Model – we added Healthcare (XLV), Energy (XLE) and Gold (IAU).
As always, we start with trading positions which have very tight stop-loss parameters. If our thesis on the position is proved correct, the position size is increased and is moved into a longer-term holding status with widened safety protocols.
This is how we approach linking longer-term views to short-term opportunities. Managing a portfolio of investments is simply measuring risk and reward and placing bets when reward outweighs the potential risk.Tweaking exposure to “risk” over time improves performance tremendously over the long-term.
The Goldilocks Warning
Lately, there has been an awful lot of talk about a “Goldilocks economy” here in the U.S. Despite a rather severe slow down globally, it is believed currently the domestic economy is going to continue to chug along with not enough inflation to push the Fed into hiking rates, but also won’t fall into recession. It is a “just right” economy which will allow corporate profits to grow at a strong enough rate for stocks to continue to rise at 8-10% per year. Every year…into eternity.
Does that really make any sense?
Particularly as we are looking at the longest expansion cycle in the history of the U.S. The problem is in the rush to come up with a “bullish thesis” as to why stocks should continue to elevate in the future, they have forgotten the last time the U.S. entered into such a state of “economic bliss".
You might remember this:
“The Fed’s official forecast, an average of forecasts by Fed governors and the Fed’s district banks, essentially portrays a ‘Goldilocks’ economy that is neither too hot, with inflation, nor too cold, with rising unemployment.” – WSJ Feb 15, 2007
Of course, it was just 10-months later that the U.S. entered into a recession followed by the worst financial crisis since the “Great Depression".
The problem with this “oft-repeated monument too trite” is that it’s absolute nonsense. As John Tamny once penned:
A “Goldilocks Economy,” one that is “not too hot and not too cold,” is very much the fashionable explanation at the moment for all that’s allegedly good. “Goldilocks” presumes economic uniformity where there is none, as though there’s no difference between Sausalito and Stockton, New York City and Newark. But there is, and that’s what’s so silly about commentary that lionizes the Fed for allegedly engineering “Goldilocks,” “soft landings,” and other laughable concepts that could only be dreamed up by the economics profession and the witless pundits who promote the profession’s mysticism.
What this tells us is that the Fed can’t engineer the falsehood that is Goldilocks, rather the Fed’s meddling is what some call Goldilocks, and sometimes worse. Not too hot and not too cold isn’t something sane minds aspire to, rather it’s the mediocrity we can expect so long as we presume that central bankers allocating the credit of others is the source of our prosperity.”
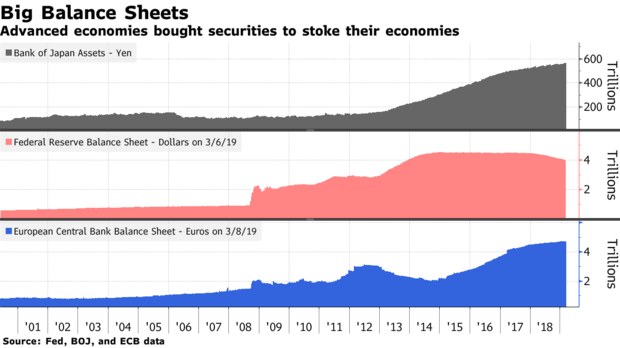
John is correct. An economy that is growing at 2%, inflation near zero, and Central banks globally required to continue dumping trillions of dollars into the financial system just to keep it afloat is not an economy we should be aspiring to. But despite commentary the financial system has been “put back together again,” then why are Central Banks acting? Via Bloomberg:
“Led by the Fed, many central banks have either held back on tightening monetary policy or introduced fresh stimulus, soothing investor fears of a slowdown. Fed Chairman Jerome Powell says he and colleagues will be patient on raising interest rates again, while European Central Bank President Mario Draghi has ruled out doing so this year and unveiled a new batch of cheap loans for banks.
Elsewhere, authorities in Australia, Canada and the U.K. are among those to have adopted a wait-and-see approach. China, at its National People’s Congress this month, signaled a willingness to ease monetary and fiscal policies to support expansion.”
Unfortunately, today’s “Goldilocks” economy is more akin to what we saw in 2007 than most would like to admit.
Job growth is slowing down.
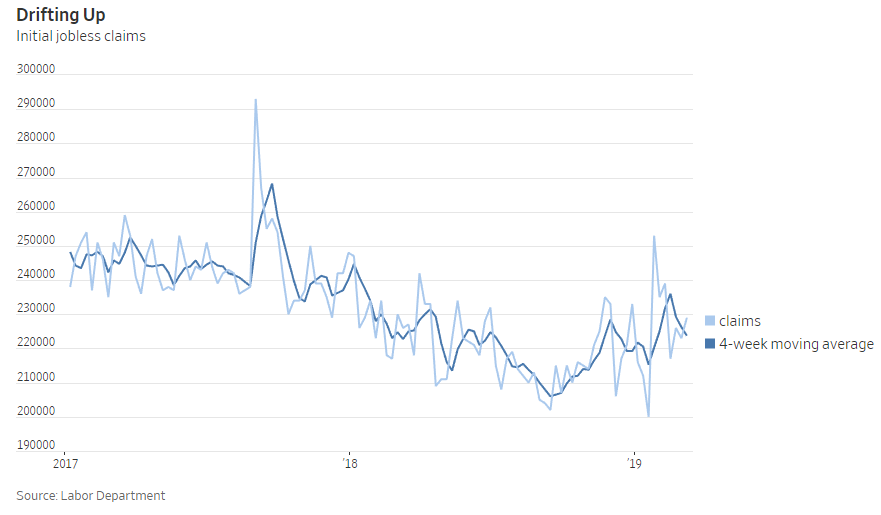
Along with economic growth.
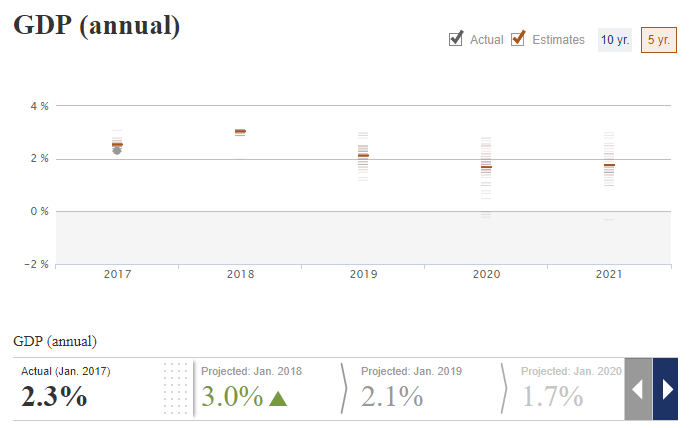
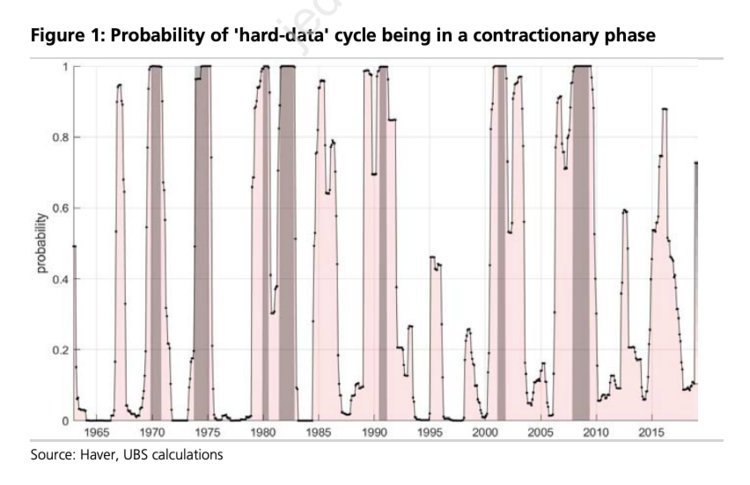
And recession risks are rising sharply.
However, it isn’t just the economy that is reminiscent of the 2007 landscape. As noted above, the markets also reflect the same. Here are a couple of charts worth reminding you of.
Notice that at the peaks of both previous bull markets, the market corrected, broke important support levels and then rallied to new highs leading investors to believe the bull market was intact. However, the weekly“sell signal” never confirmed that rally as the “unseen bear market” had already started.
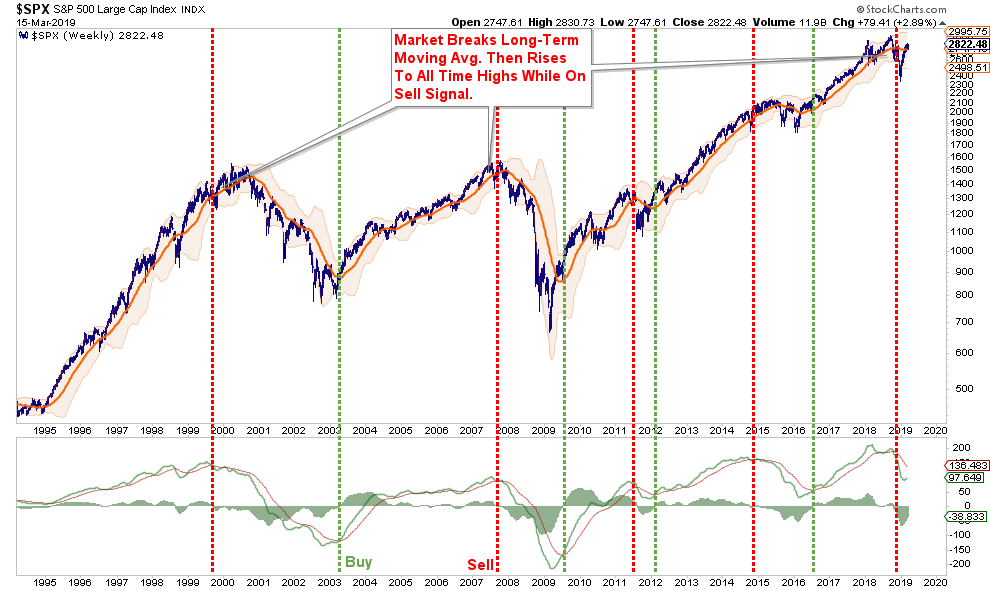
Currently, relative strength as measured by RSI on a weekly basis has continued to deteriorate. Not only was such deterioration a hallmark of the market topping process in 2007, but also in 2000.

The problem of suggesting that we have once again evolved into a“Goldilocks economy” is that such an environment of slower growth is not conducive to supporting corporate profit growth at a level to justify high valuations.
It is true that the bears didn’t eat Goldilocks at the end of the story…but then again, there never was a sequel.
Simple Actions To Take Now You Will Appreciate Later
- Trim positions that are big winners in your portfolio back to their original portfolio weightings. (ie. Take profits)
- Sell underperforming positions. If a position hasn’t performed during the rally over the last three months, it is weak for a reason and will likely lead the decline on the way down.
- Positions that performed with the market should also be reduced back to original portfolio weights. Hang with the leaders.
- Move trailing stop losses up to new levels.
- Review your portfolio allocation relative to your risk tolerance. If you are aggressively weighted in equities at this point of the market cycle, you may want to try and recall how you felt during 2008. Raise cash levels and increase fixed income accordingly to reduce relative market exposure.
How you personally manage your investments is up to you. I am only suggesting a few guidelines to rebalance portfolio risk accordingly. Therefore, use this information at your own discretion.
Market & Sector Analysis
Data Analysis Of The Market & Sectors For Traders
- Market & Sector Analysis
- Recommendations
- Portfolio Allocations
- Client Portfolio Changes & Updates
THE REAL 401k PLAN MANAGER
A Conservative Strategy For Long-Term Investors
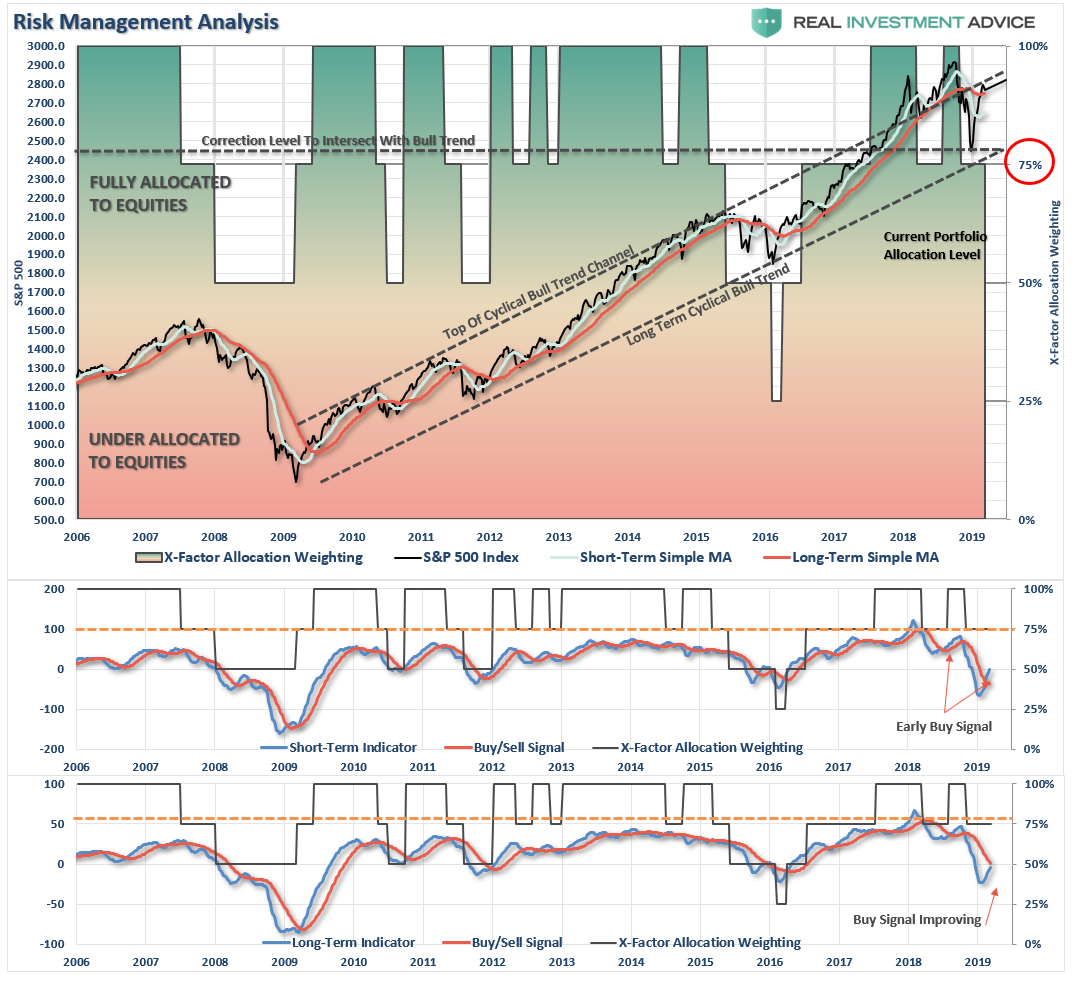
There are 4-steps to allocation changes based on 25% reduction increments. As noted in the chart above a 100% allocation level is equal to 60% stocks. I never advocate being 100% out of the market as it is far too difficult to reverse course when the market changes from a negative to a positive trend. Emotions keep us from taking the correct action.

Market Rallies, Be Patient
As we have been discussing over the last several weeks, the sharp rally in stocks has gone too far, too quickly, so just be patient here and wait for a correction/consolidation to increase exposure. The rally this past week was positive but remains very narrow in terms of participation.
The break out of the recent consolidation range is bullish so you CAN increase exposure in portfolios modestly. However, the backdrop is not strong enough on a risk/reward basis to take the portfolio allocation model back to 100% just yet.
Also, this rally remains concerning, as I stated last week:
“Take a look at the chart above. Beginning in 2016, I drew a bull trend channel for the market in the chart above (the dashed 45-degree black lines) which have contained the bull market rally since the 2009 lows.
In January 2018, the market made, as we stated then, and unsustainable break above that upper trend line. I add the horizontal black dashed line at that point and said that ultimately we would see a correction back the long-term bull trend line.
Since then, exactly that has happened and rather than the market retesting the lower bullish trend line and then beginning a more normal advance, the market rocketed higher in 2-months to hit AND FAIL at the upper bullish trend line.
If the last decade provides any clues, it is likely the market is going to remain range bound within this rising trend for now, which suggests that waiting for a better entry point to increase exposure will be rewarded.”
As we noted last week, wanted to be patient and wait for a rally. That rally ran faster than expected but broke above recent resistance.
- If you are overweight equities – take some profits and reduce portfolio risk on the equity side of the allocation. However, hold the bulk of your positions for now and let them run with the market.
- If you are underweight equities or at target – rebalance portfolios to model weights currently. Hold positions for now and increase allocations in modestly as needed to get towards target weights.
If you need help after reading the alert; don’t hesitate to contact me.
Current 401-k Allocation Model
The 401k plan allocation plan below follows the K.I.S.S. principle. By keeping the allocation extremely simplified it allows for better control of the allocation and a closer tracking to the benchmark objective over time. (If you want to make it more complicated you can, however, statistics show that simply adding more funds does not increase performance to any great degree.)
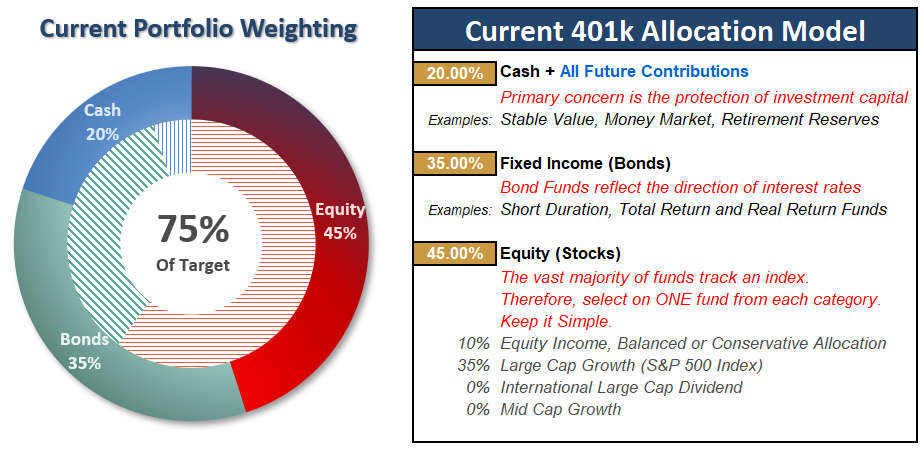
401k Choice Matching List
The list below shows sample 401k plan funds for each major category. In reality, the majority of funds all track their indices fairly closely. Therefore, if you don’t see your exact fund listed, look for a fund that is similar in nature.


