
The Foolish Small Cap 8 Screen Formula And Variations
The Motley Fool's Foolish Small Cap 8 Screen can help you pick trending small-cap stocks for the medium-long term. However, know that 2020 is a once-in-a-lifetime year in which corporate earnings have been smashed beyond recognition. Therefore, this post contains the original screener with 2 variations - the first variation compares the financials with the sector median and the second variation contains a couple of technical indicators to help you further sharpen your picks.
Before getting to the formulas, know that the screener has delivered superior returns as compared to the SPX and the SP600 in the long run.
(Click on image to enlarge)
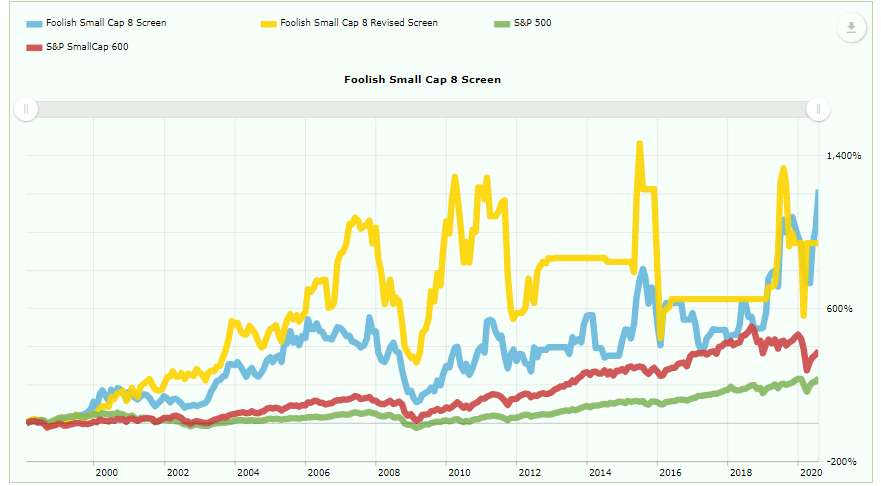
Image Source: AAII
ORIGINAL FORMULA: Foolish Small Cap 8 Screen
|
S. No. |
CONDITION |
VALUES |
|
1 |
TTM Sales |
Lesser than or equal to $500 million |
|
2 |
TTM EPS Growth |
Greater than or equal to 25% |
|
3 |
TTM Sales Growth |
Greater than or equal to 25% |
|
4 |
TTM Net Income Margin |
Greater than or equal to 7% |
|
5 |
TTM Operating Cash |
Greater than 0 |
|
6a |
Volume X Price last 3 months Avg |
Greater than or equal to $1,000 million |
|
6b |
Volume X Price last 3 months Avg |
Lesser than or equal to $25,000 million |
|
7 |
Insider Ownership |
Greater than 10% |
|
8 |
Price |
Greater than $7 |
|
9 |
% Rank Relative Strength 52 week |
Greater than or equal to 90 |
|
10 |
Not Listed on |
OTC |
VARIATION 1: This variation benchmarks the performance with the sector medians rather than a fixed percentage. So if the company is an outperformer, it will anyway exceed the sector median benchmarks.
|
S. No. |
CONDITION |
VALUES |
|
1 |
TTM Sales |
Lesser than or equal to $500 million |
|
2 |
TTM EPS Growth |
Greater than or equal to sector median |
|
3 |
TTM Sales Growth |
Greater than or equal to sector median |
|
4 |
TTM Net Income Margin |
Greater than or equal to sector median |
|
5 |
TTM Operating Cash |
Greater than 0 |
|
6a |
Volume X Price last 3 months Avg |
Greater than or equal to $1,000 million |
|
6b |
Volume X Price last 3 months Avg |
Lesser than or equal to $25,000 million |
|
7 |
Insider Ownership |
Greater than 10% |
|
8 |
Price |
Greater than $7 |
|
9 |
% Rank Relative Strength 52 week |
Greater than or equal to 90 |
|
10 |
Not Listed on |
OTC |
VARIATION 2: This variation adds 3 technical indicator benchmarks that the stock has to pass. These indicators will help you pick stocks that are in momentum.
|
S. No. |
CONDITION |
VALUES |
|
1 |
TTM Sales |
Lesser than or equal to $500 million |
|
2 |
TTM EPS Growth |
Greater than or equal to sector median |
|
3 |
TTM Sales Growth |
Greater than or equal to sector median |
|
4 |
TTM Net Income Margin |
Greater than or equal to sector median |
|
5 |
TTM Operating Cash |
Greater than 0 |
|
6a |
Volume X Price last 3 months Avg |
Greater than or equal to $1,000 million |
|
6b |
Volume X Price last 3 months Avg |
Lesser than or equal to $25,000 million |
|
7 |
Insider Ownership |
Greater than 10% |
|
8 |
Price |
Greater than $7 |
|
9 |
% Rank Relative Strength 52 week |
Greater than or equal to 90 |
|
10 |
Not Listed on |
OTC |
|
11 |
WEEKLY MACD (26,12,9) HISTOGRAM |
Greater than 0 |
|
12 |
WEEK RSI (14) |
Greater than 58 |
|
13 |
DAY RSI (14) |
Crossed above 60 |
Plug these screens into your code and track. My suggestion is to avoid the original screen version because this is an extraordinarily disruptive year and most companies will not be able to pass the stiff benchmarks contained in the original version. If you have questions, feel free to ask in the comments section.
Disclosure: I have no position in the stocks discussed, and neither do I plan to buy/sell it in the next 72 hours. I researched and wrote this article. I am not being compensated for it (other ...
more


Interesting but I am not sure just what to think.
What do you mean?