The Double-Death Cross And The Bear Market Moving Average Pattern
The traditional definition of a bear market — a drop of 20% — is meaningless for trading. Traders need to know if the market is heading up or down. Saying it has dropped 20% only tells you that it has gone down. The market may turn around at that point and start going back up or it might drop another 60%. To be able to find out whether the market is changing direction or is going to continue falling, it is necessary to use some market tracking indicators that will follow the market’s direction. This should be done long before the market falls 20%.
In two previous articles, the Double-Death Cross has been discussed and how it can be used to determine sell signals on stocks and an impending bear market by using it with multiple stock indices. Those articles can be found here and here. The Double-Death Cross is a three moving average system using the 50-day, 200-day, and 325-day (or the 10-week, 40-week and 65-week) moving averages. The 50-day and 200-day come from traditional stock trading and the 65-week comes from traditional commodity trading where it is used to determine whether or not a commodity is behaving bullishly or bearishly. Using the three moving averages together creates are a far more robust trading system that can confirm market turns and trends.
Using these three moving averages to provide a valid signal in a change in trend has been discussed in the aforementioned articles. What should their behavior be though to indicate an ongoing downtrend? In succession, the 50-day, then the 200-day and finally the 325-day will start turning down. The 50-day will cross the 200-day and it will subsequently fall below the 325-day. At that point, the three moving averages will be lined up from top to bottom in the following order: 325-day, 200-day, and 50-day. Over time, the 325-day and the 200-day will likely be moving down approximately in parallel. The 50-day is prone to move in a bouncy up and down fashion and may even touch the 200-day at one or more points as it continues lower. As long as the 325-day and 200-day (or 65-week and 40-week) averages are both moving down and the 325-day is above the 200-day, the bear market is intact and rallies should be thought of as potentially shorting opportunities.
Here is a three-year weekly chart of the Russian market (RSX) and of commodity copper (JJC), both of which have been in long-term bear markets, illustrating these points:
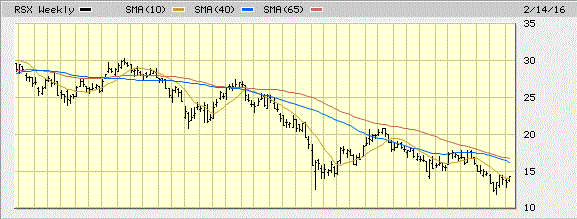
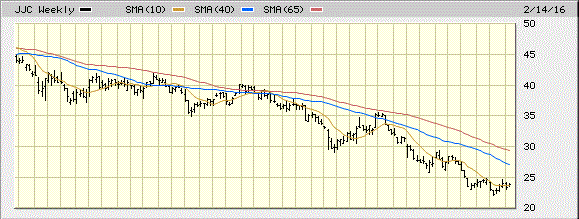
So, what does the current picture look like for the major U.S. market indexes? They have all made the Double-Death Cross (three of them had done so in the fall of 2015, but the Nasdaq didn’t, which allowed a market rally to ensue for the Nasdaq, Dow and S&P 500). The small cap, broader market Russell 2000 didn’t participate and developed the moving average bear market pattern described above.
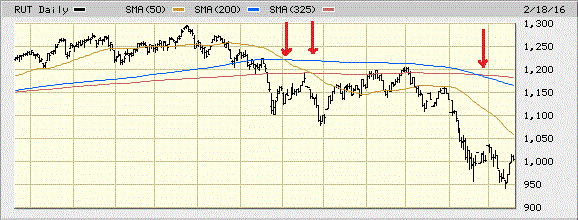
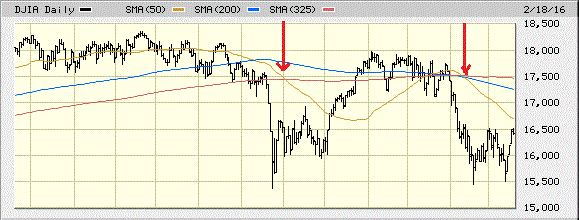
The remaining three indexes rallied, however. Then the Dow and S&P 500 made the Double-Death Cross again in January. The 200-day on the Dow also fell below its 325-day at the same time. This took until the beginning of February before it occurred on the S&P 500. The bear market moving average pattern was then complete for both indexes.
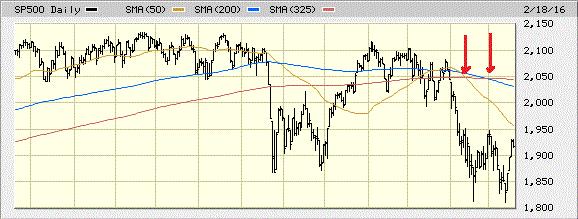
So far in 2016, the Nasdaq has trailed the Dow and S&P 500 by a few weeks. It made the Double-Death Cross at the beginning of February, but the 200-day moving average still hadn’t fallen below the 325-day by mid-Febuary. Nevertheless, the 200-day began declining in mid-January and the 325-day followed in February. The 50-day is well below both of them and price is well below the 50-day. It will be almost mathematically impossible for the 200-day not to make the cross of the 325-day that will complete the bear market moving average pattern. It would require a very fast and significant rally that took prices above the 325-day moving average and more importantly kept them at the level (the really difficult part). Since the chart has already begun a pattern of lower highs and lower lows and there are two consecutive gaps that can only be filled if Nasdaq drops, there are headwinds acting against any big rally.
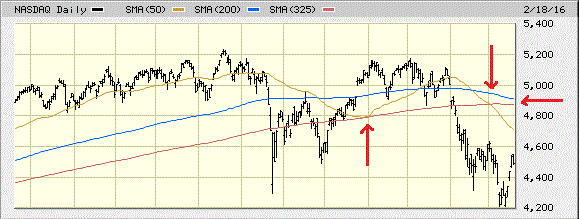
Based on its current trajectory, the 200-day moving average on Nasdaq should fall below the 325-day around early March (give or take a few days either way). When that happens, there is nothing to prevent a much bigger drop in U.S. stock prices. Other indicators, though, will have to be used to determine the timing for any new move down.
None.


