
The Dividend Kings Ranked By Quality Score
David Van Knapp presented a simple and seemingly effective quality scoring system in this article on high-quality, high yield dividend growth stocks. The system employs five widely used quality indicators from independent sources and assigns 0-5 points to each quality indicator, for a maximum of 25 points.
In this article, I use a slightly modified version of the quality scoring system to rank an elite group of stocks called the Dividend Kings. Dividend kings are companies that have increased their dividend payouts for at least 50 consecutive years.
This is a companion article to one in which I ranked the Dividend Aristocrats, which are S&P 500 stocks that have increased their dividend payouts for at least 25 consecutive years. While there is some overlap between Dividend Kings and Dividend Aristocrats, the constitution of these lists is different enough so that several stocks are unique to the Dividend Kings.
Dividend Kings
Dividend Kings are companies that have raised their dividends for 50 consecutive years or more.
To attain this extraordinary track record, Dividend Kings had to survive economic recessions and market crashes, technological advances and busts, and periods of inflation. These companies display the highest degrees of discipline, commitment, stability, resilience, and reliability.
Dividend Kings have performed quite well when compared to the S&P 500. While tracking the performance of the Dividend Kings suffers from survivorship bias, nevertheless, it is informative to consider historical performance.
Simply Safe Dividends provides an informative analysis:
Source: Simply Safe Dividends
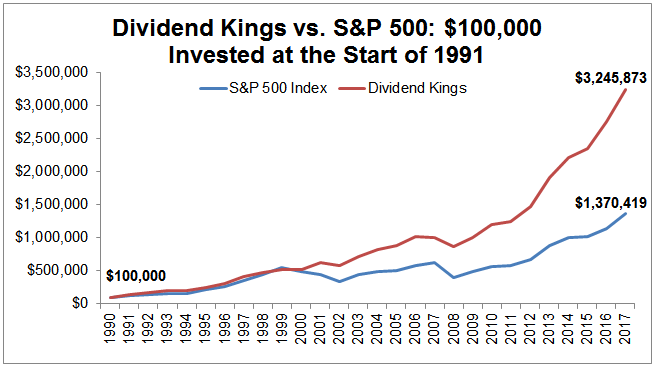
An investment of $100,000 in the S&P 500 index in 1991 would have grown to nearly $1.4 million at the end of 2017, at a compound annual growth rate of 10.2%. In comparison, the same investment in the current Dividend Kings would have grown to about $3.2 million, for annual returns of 13.8%.
Notwithstanding the survivorship bias issue, the Dividend Kings' outperformance is significant. Furthermore, over the 27-year period, a portfolio of the Dividend Kings exhibited annual volatility of 12.5%, which is much lower than the volatility of the S&P 500 index of 17.3% of the same period.
Quality Scores
Before presenting my ranking of Dividend Kings, here is a brief summary of David Van Knapp's quality scoring system and my modifications.
As mentioned earlier, the system references five quality indicators, assigning 0-5 points to each quality indicator for a maximum score of 25 points.
The first quality indicator is Value Line's Safety Rank, which measures the total risk of a stock relative to approximately 1,700 other stocks covered by Value Line. The safest stocks get a rank of 1 and the riskiest stocks get a rank of 5.
Value Line also provides a Financial Strength rating, based on factors such as balance sheet strength, corporate performance, market capitalization, and stability of returns. The scale runs from A++ to C in nine steps.
Morningstar's Economic Moat is the third quality indicator and it reflects the strength and sustainability of a company's competitive advantage. Morningstar differentiates between wide, narrow, and no moat companies
Standards & Poors (S&P) provides credit ratings to help investors determine investment risks. The ratings are either investment grade (AAA through BBB–) or speculative (BB+ through D).
The final quality indicator is Simply Safe Dividend's Dividend Safety Scores, which range from 0 to 100 and are based on more than a dozen fundamental metrics that influence the ability of companies to continue paying dividends:

Here is the scoring system used, a slightly modified version of the one presented by David Van Knapp:
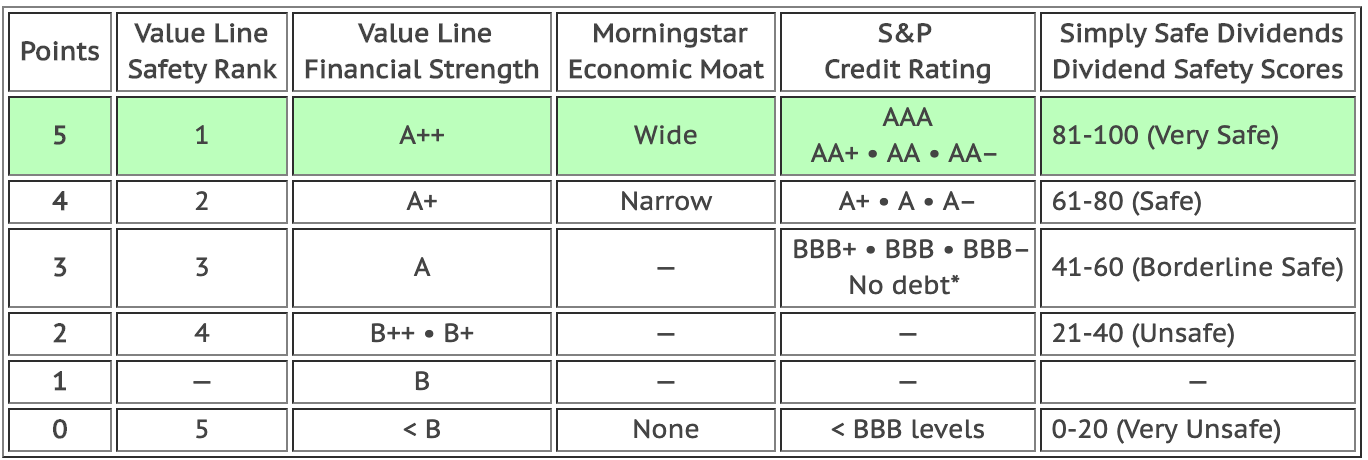
Modified version of David Van Knapp's quality scoring system.
My modifications include assigning 3 points to companies that don't have an S&P Credit Rating but carry no debt. Also, I award points for Dividend Safety Scores matching the colored ranges above (which may have been David's intent but was not so presented in the linked article).
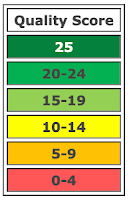
Below, I'm presenting all the Dividend King ranked by quality score, defined as the sum of points assigned per quality indicator. With five quality factors and a maximum score of 5 points per quality indicator, the maximum score is 25.
I use a similar color coding scheme than in the original article, though I differentiate perfect scores:
Finally, I needed a way to break ties in order to rank stocks, so I consider the following in turn:
- Dividend Safety Score
- S&P Credit Rating
- Dividend Yield
For example, since Johnson & Johnson (JNJ) and Procter & Gamble (PG) both have quality scores of 25 and dividend safety scores of 99, I use the S&P Credit Rating as the tie-breaker. So JNJ wins out because it has an AAA credit rating.
Key Metrics and Fair Value Estimates
In addition to quality indicators and quality scores, I provide columns with key metrics of interest to dividend growth investors, including years of consecutive dividend increases (Yrs), dividend Yield for a recent Price, and 5-year compound annual dividend growth rate (5-Yr DGR).
Furthermore, I provide a fair value estimate (Fair Val.) to help identify stocks that trade at favorable valuations. The last column shows the discount (Disc.) or premium (Prem.) of the recent price to the fair value estimate.
To estimate fair value, I reference fair value estimates and price targets from several sources:
- Morningstar: fair value estimate based on discounted cash flow analysis
- Finbox.io: fair value estimate based on several financial models
- Finbox.io: average of analyst targets
- Value Line: average of target range
Additionally, I estimate fair value using the 5-year average dividend yield of each stock using data from Simply Safe Dividends:
fair value estimate = recent price × dividend yield ÷ 5-year average dividend yield
With five estimates and targets available, I ignore the outliers (the lowest and highest values) and use the average of the median and mean of the remaining values as my fair value estimate.
Dividend Kings with Perfect Quality Scores
The top-ranked Dividend Kings are JNJ and PG, both earning perfect scores of 25.
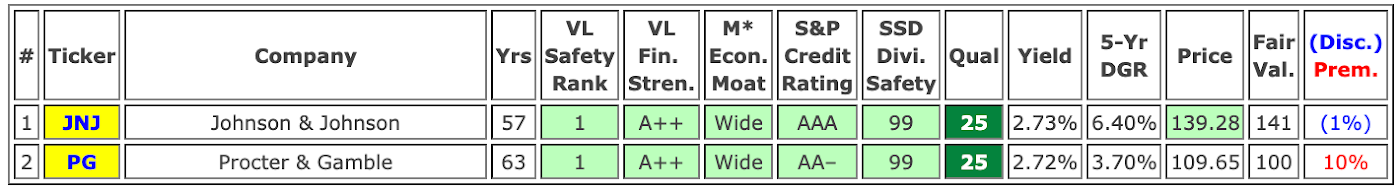
I own both stocks in my DivGro portoflio (as highlighted in the Ticker column). PG is trading at a premium to fair value, but JNJ is trading near fair value and may be worth a look. A price below $134 would be preferable, in my view.
Dividend Kings with Quality Scores of 23-24
The stocks in the second group missed a perfect score on up to two of the quality indicators.

I own two of these stocks, 3M (MMM) and Coca-Cola (KO).
MMM is trading below fair value, but my MMM position is a larger-than-average 1.27% of portfolio value, so I'm not really interested in adding more shares at this time.
On the other hand, Emerson Electric (EMR) offers great value. Instead of opening a position, though, I decided to sell put options and collect options income. So I sold two $60 put options expiring in December and collected $374. Should these options be exercised, I'll buy EMR for $58.13 per share.
Dividend Kings with Quality Scores of 20-22
The next group of stocks fell short on up to five quality indicators.

I own three of these stocks, Lowe's (LOW), Hormel Foods (HRL), and Stanley Black & Decker (SWK).
I have some room to add to my LOW position, though I'd like to see the price below $98 per share. LOW's 5-year dividend growth rate is impressive but its yield is a bit low.
HRL and SWK are not offering great value at this time, so I'm not interested in adding to my positions at this time.
Of the stocks I don't own, Parker-Hannifin (PH) looks interesting. The stock yields 2.07% and has a 5-year dividend growth rate of 10.6%. I'm putting it on my list of stocks to investigate.
Unfortunately, none of the remaining stocks are trading at compelling levels.
Dividend Aristocrats with Quality Scores of 15-19
This group of stocks fell short on up to three quality indicators.
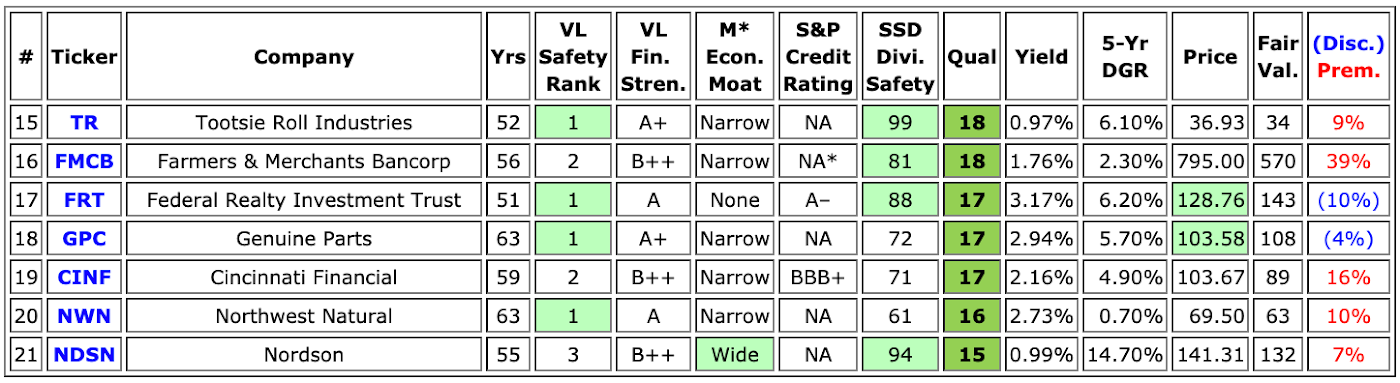
I don't own any of these stocks, although I previously owned Federal Realty Investment Trust (FRT).
I decided to close my position in FRT in April 2019 as the REIT's yield is on the low side at about 3% and its dividend growth rate has slowed down in recent years. Another reason is that I held this position in a taxable account. When the time is right to reinvest, I'll do so in one of my IRAs.
Again, none of the remaining stocks are trading at compelling levels, though Genuine Parts (GPC) offers some value trading below fair value.
Dividend Kings with Quality Scores below 15
The next group of stocks missed on up to four quality indicators.
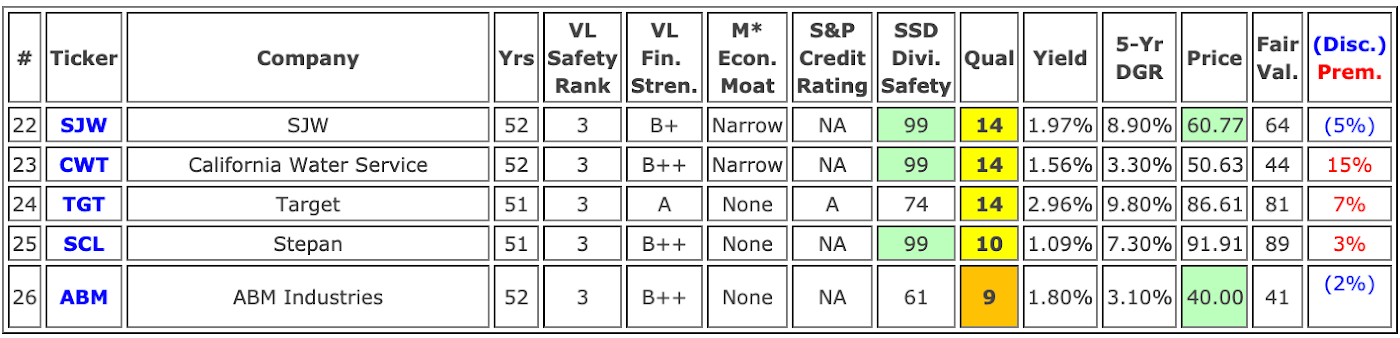
I don't own any of these stocks, although I previously owned Target (TGT). I closed my position in December 2017 to harvest tax losses. In hindsight, closing my TGT position was a poor move as the stock price shot up soon thereafter and I have yet to find a good reentry point.
Conclusion
I love the simplicity of David Van Knapp's quality scoring system and I believe it does a remarkable job of identifying high-quality stocks. The quality scoring system is quite stringent and stocks scoring 20-25 points would be considered high-quality stocks by many investors.
In this article, I used a slightly modified version of David Van Knapp's system to rank the Dividend Kings, an elite group of stocks that have increased their dividend payouts for 50 consecutive years or more. I've highlighted some stocks I find worthy of further consideration, especially those trading below fair value.
Of the 26 Dividend Kings, 14 have quality scores in the 20-25 range, and only five of the remaining stocks have quality scores below 15 points. The Dividend Kings include some truly are high-quality stocks!
Hopefully, the article will give dividend growth investors a good starting point for stock selection and further research. As always, though, I encourage you to do your own due diligence before investing.
Thanks for reading and happy investing!
Disclaimer: I'm not an investment professional or a licensed financial advisor. This article represents my personal views and decisions, ...
more

