
The Case For Equal Weight Indexing
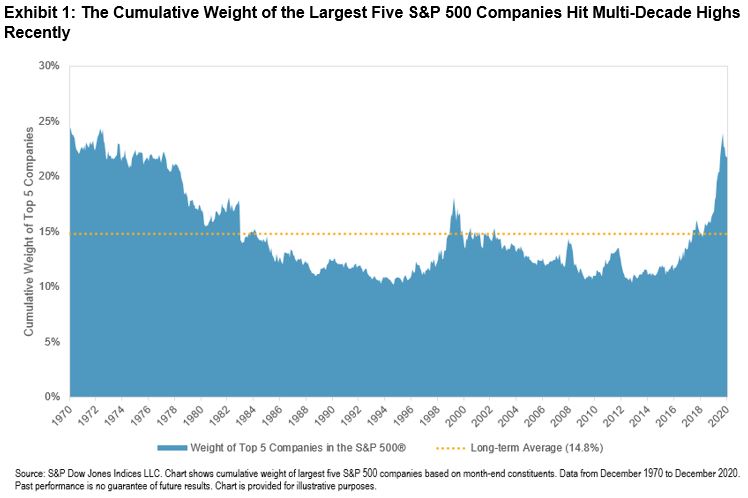
2020 witnessed outperformance from some of the largest S&P 500® companies as investors expected these firms to be better placed to navigate the COVID-19 environment. Exhibit 1 shows that this outperformance led to the largest names accounting for an unusually high proportion of the U.S. large-cap equity benchmark, and therefore having a bigger impact on the index’s returns. For investors looking to gain large-cap exposure with lower sensitivity to the biggest names, and potentially to take advantage of reductions in market concentration, Equal Weight may be worth considering.
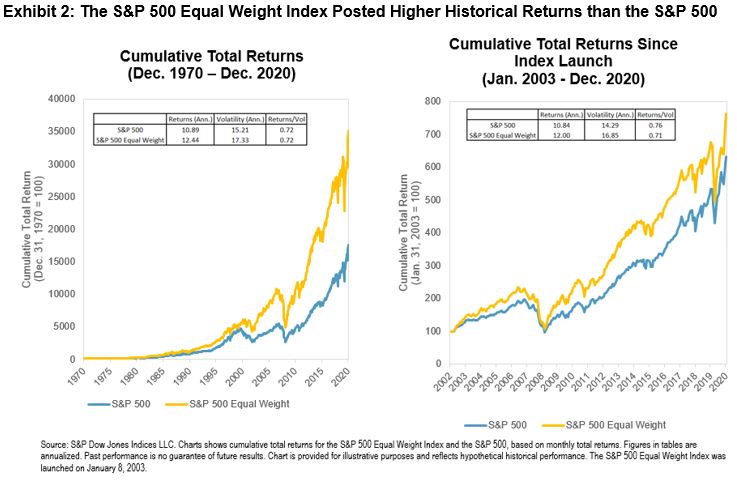
Launched in January 2003, the S&P 500 Equal Weight Index weights each S&P 500 company equally at each quarterly rebalance. Exhibit 2 shows the historical benefit from applying this weighting scheme within U.S. large caps; the S&P 500 Equal Weight outperformed since its launch as well as over its lengthier, back-tested history. Rather than being strictly a U.S. phenomenon, the outperformance in Equal Weight indices has been observed globally, including in Japan.
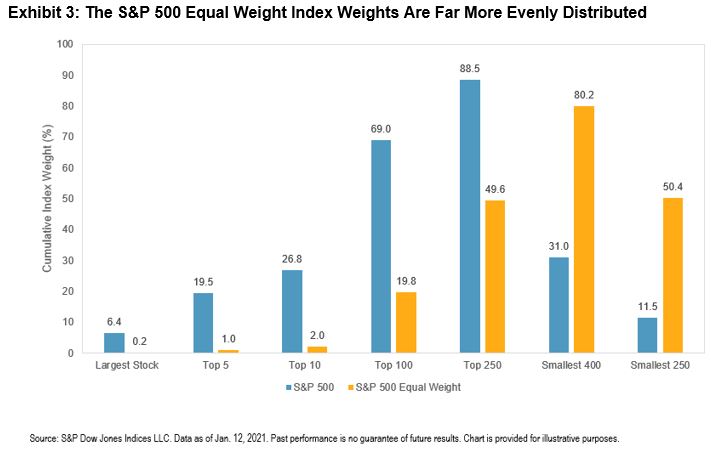
One of the key perspectives in explaining equal weight indices’ returns is their smaller size exposure: for example, over 50% of the historical variation in the S&P 500 Equal Weight Index’s relative returns is explained by size.This exposure occurs because, as Exhibit 3 illustrates, the distribution of weights within equal weight indices is far more even than within their market-cap weighted parents. For example, the S&P 500 Equal Weight Index is far less sensitive to the performance of the largest names in the market and offers more exposure to smaller S&P 500 companies.
Equal weight’s smaller size exposure helps to explain the link between market concentration and equal weight’s relative returns. All else equal, if the largest companies (to which equal weight has less sensitivity) outperform, concentration rises, and equal weight is likely to underperform its cap-weighted benchmark. Conversely, outperformance among smaller companies (to which equal weight has greater allocations) leads to reduced concentration and the likelihood of equal weight outperformance.
Exhibit 4 shows that this dynamic is exactly what has been observed historically. The S&P 500 Equal Weight Index’s cumulative relative total return versus the S&P 500 typically rose (fell) as concentration, measured by the cumulative weight of the largest five S&P 500 companies, fell (rose). This dynamic includes December 2020, when Equal Weight outperformed and concentration declined as the beginning of vaccine rollouts particularly benefited smaller companies that had been more impacted by the “COVID correction” last year.

The current market environment may present an opportunity for investors to consider Equal Weight in order to diversify away from some of the largest market constituents. The S&P 500 Equal Weight Index’s smaller size bias may also benefit investors anticipating reductions in market concentration.
Disclaimer: Copyright © 2020 S&P Dow Jones Indices LLC, a division of S&P Global. All rights reserved. This material is reproduced with the prior written consent of S&P DJI. Please ...
more

