

Image Source: Unsplash
I think one would be hard-pressed to find a financial instrument as chart-compliant as Tesla's stock. It often behaves itself beautifully with respect to its Fibonacci retracement levels and major trendlines, and what has transpired over the past couple of weeks illustrates that neatly.
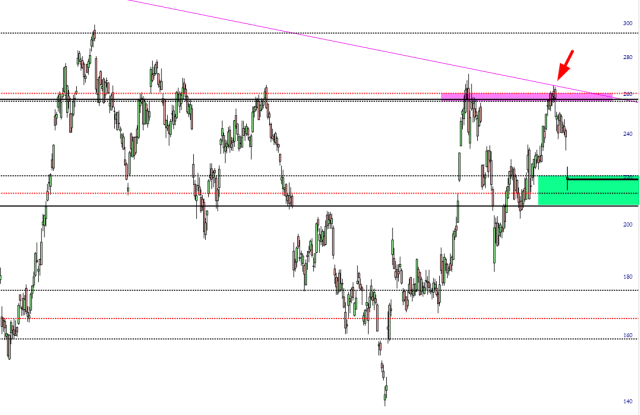
The stock peaked (medium-term) on the last day of September, tagging a descending trendline that commenced at its lifetime high of $414.50 about 35 months ago. I suppose this must have been excitement about the Oct. 10 event. It has lost about 15% since then, and now I believe this is an area of strong support (the green tint represents the trio of Fibs in this zone).
More By This Author:
Moderated De-RateCouple Of Obscure Semis
Index Path Update

Comments
Log in or sign up to join the conversation.