
Tesla Is The Most Shorted US Stock Again! What's Next For It?
While Tesla's stock price surges to new all-time high price levels, there are those who are positioning themselves for the stock to crash and burn. Data from financial-analytics firm S3 Partners shows that Tesla has become the most shorted stock in the United States, once again. This is now creating some very interesting and unique trading opportunities as this article highlights.

Tesla's $15 billion short interest: Should we pay attention?
According to data from financial analytics firm S3 Partners, Tesla's short interest - the amount of shares that are being borrowed to bet against it - ballooned to nearly $15 billion on 14 January 2020. This makes Tesla shares the most shorted stock in the United States - and not for the first time.
While some investors believe in Elon Musk's vision, short-sellers like Jim Chanos believe it is a worthless enterprise. And while short sellers continue to build positions they are losing money in the droves as Tesla's shares have rocketed nearly 25% higher in 2020 alone and nearly 70% higher from the beginning of December 2019 to 14 January 2020.
Tesla surprised investors with positive vehicle delivery numbers in 2019, something they have struggled with in the past. There's also a lot of optimism regarding the company's Gigafactory in Shanghai which is set to tap into the largest electric vehicle market, China.
However, while well-known and active short-seller Jim Chanos believes Tesla is an amazing vehicle, he also believes the rest of the world is catching up. Other automakers like Volkswagen have been slower coming into the electric vehicle market but market competition is now heating up. Has Tesla got what it takes to survive? Let's have a look at its share price.
How to trade Tesla shares
With Admiral Markets you can speculate on Tesla's share price by using CFDs (Contracts for Difference). This means you can go long and short and potentially profit from rising and falling markets - without ever owning the underlying asset. That could prove to be useful when trading a volatile company like Tesla.
Below is the long-term weekly chart of Tesla's share price:
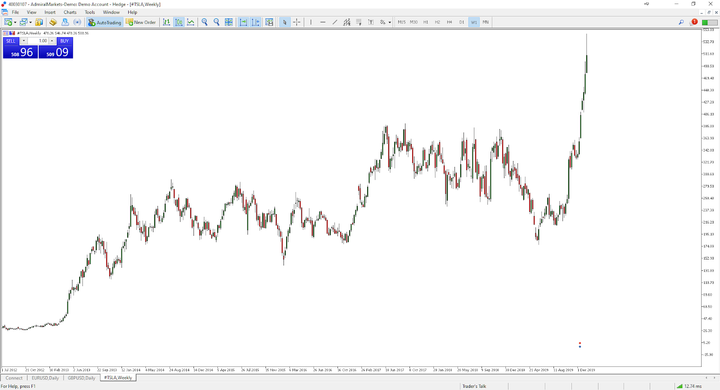
Source: Admiral Markets MT5 Supreme Edition, TSLA, Weekly - Data range: from 1 July 2012 to 20 January 2020, accessed on 20 January 2020 at 11:35 am GMT. - Please note: Past performance is not a reliable indicator of future results.
It is clear to see the choppy and sideways moving price action in Tesla's share price. In fact, it was only at the end of 2019 that Tesla's share price really started to move - largely thanks to a surprise in its delivery numbers and developments with new factories in China.
Picking out where the company's share price could be in five years time is a challenging task, especially given the long-term price action above and the fact that more players are moving into the electric vehicle market.
However, in the short-term, it is clear to see that the momentum is with buyers. Therefore, going down to the lower timeframes such as the four-hour chart and looking to trade with them may result in higher probability trading opportunities.
As with any investment, you can make or lose money, so timing and risk management is important. The chart below shows Tesla's four-hour chart with a 50-period exponential moving average plotted on price:
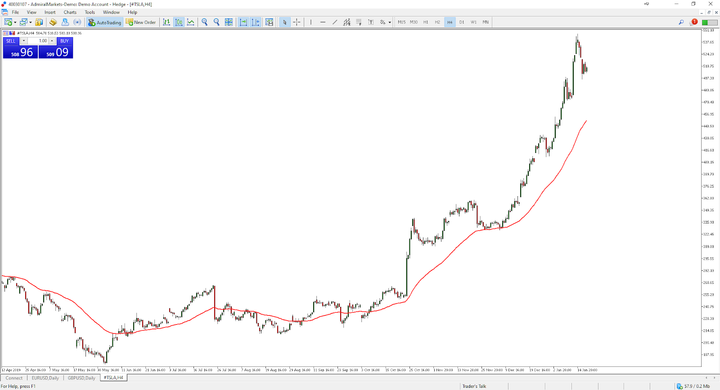
Source: Admiral Markets MT5 Supreme Edition, TSLA, H4 - Data range: from 12 April 2019 to 20 January 2020, accessed on 20 January 2020 at 12:35 pm GMT. - Please note: Past performance is not a reliable indicator of future results.
The four-chart above shows that buyers tend to remain in control of the market direction when price is trading above the 50-period exponential moving average (the red line). Therefore, if price can remain above this level, short-term traders may keep looking for long, or buy, entries.
Traders may use a combination of support levels such as bounces off the moving average, trend lines or horizontal support lines to identify areas where buyers may come into the market next. Often, traders will also use price action patterns to further identify clues of buyers entering the market. How will you be trading it?
Disclaimer: The given data provides additional information regarding all analysis, estimates, prognosis, forecasts or other similar assessments or information (hereinafter "Analysis") ...
more

