
TECK – Another Stock Performing Well
(Click on image to enlarge)
TECK was another strong performer from last week and just to highlight my comments from my post of the 30th November in which I wrote as a summary:
So in the short term expect to see the stock test the two areas of price-based resistance, and once the second of these is cleared at $19 per share this one is likely to take off again and on towards $24 per share and beyond.
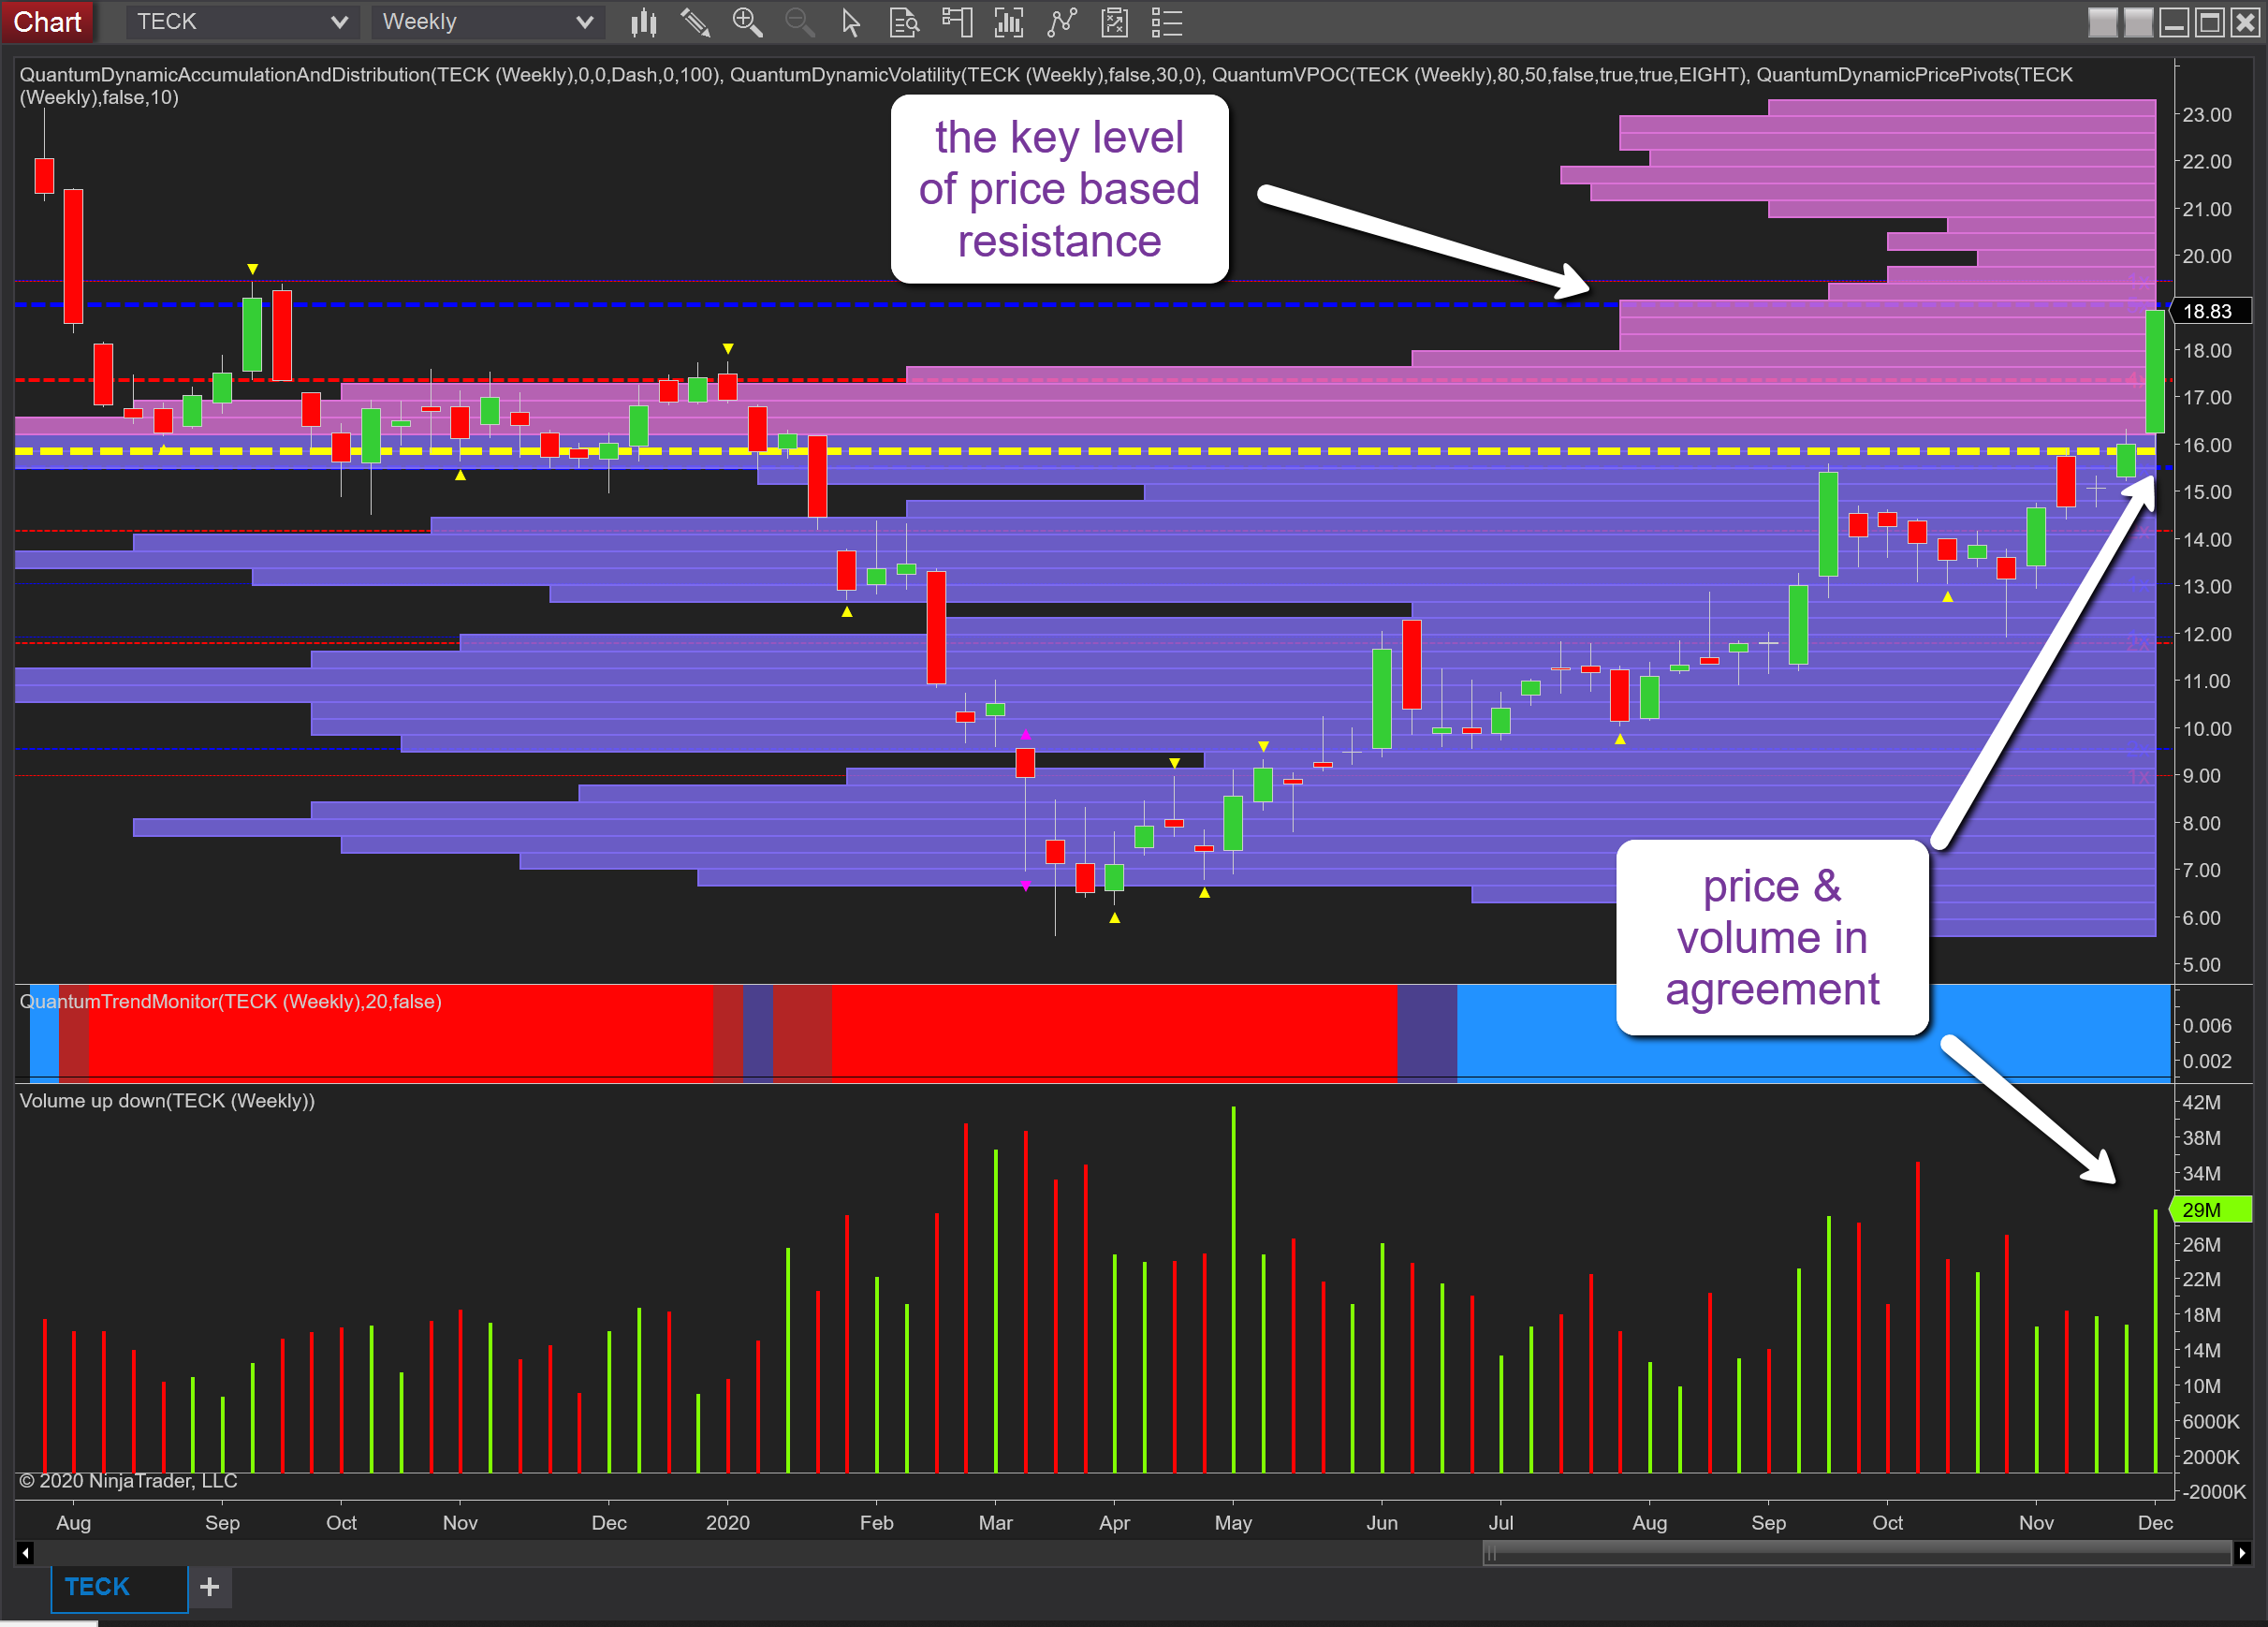
As we can see from the weekly chart it was a positive performance for the stock, closing with a wide spread up candle and ending at $18.83 per share on excellent associated volume, so as per Wyckoff’s third law, volume and price are in agreement as we break free from the volume point of control now well below and denoted with the yellow dashed line. So what next for this stock,? And to answer my own question the outlook remains extremely positive, but with one caveat and this is the price-based resistance now immediately ahead and denoted with the blue dashed line. In fact, this was tested last week and held firm, so is now a key area. However, if this is breached as expected we have a clear run to $24 per share and beyond as volume drops away dramatically on the VPOC histogram thereby presenting a smooth path higher for the stock which is also supported by the trend monitor indicator below.
Disclaimer: Futures, stocks, and spot currency trading have large potential rewards, but also large potential risk. You must be aware of the risks and be willing to accept them in order to invest in ...
more

