
Technically Speaking: Tops Are Processes, Bottoms Are Events
In April of 2018, I posted an article laying out 10 reasons why the “bull market” had likely ended for a while. To wit:
“I highly suggest you use any substantial rally to reduce risk and rebalance portfolios accordingly. Why? Because I am going to out on a limb and making a call.’I think the 9-year old bull market may have ended in February.’”
As I stated then:
“In 2015, the market plunged as Fed Chair Janet Yellen brought QE3 to its conclusion and started hiking interest rates for the first time in 9-years. Again, this correction would likely have been substantially deeper as the Eurozone faced ‘Brexit’ which sent shocks through the market. The well-timed phone calls to the Bank of England and the European Central Bank by then Fed Chairman Yellen, to take over liquidity operations stemmed the decline. Also as opposed to 2000 and 2007, the Fed had only just started its rate-hiking campaign.”
“Today’s market correction is more aligned with the end of a market cycle versus the beginning of one. The market is facing numerous headwinds that did not exist in 2011 or 2015.”
Of course, the Fed leaped into action in December to reverse course on their direction of monetary policy which provided the boost stocks needed. However, while the two periods are much aligned, there is a substantial list of headwinds that exist currently:
- The “debt ceiling” will return with a vengeance given the deeply divided Congress as the 2019 Government budget ends. There is a risk of another Government shutdown looming.
- Earnings estimates for 2019 fell sharply as I previously stated and 2020 estimates are now on the decline.
- Stock market targets for 2019 are too high along with 2020.
- Rising geopolitical tensions between India, Pakistan, Russia, China, Iran, etc.
- The effect of the tax cut legislation has disappeared as year-over-year comparisons are reverting back to normalized growth rates.
- Economic growth is slowing.
- Chinese economic data has weakened further.
- European growth, already weak, continues to weaken and most of the EU will likely be in recession in the next two quarters.
- Valuations remain at expensive levels.
- Asset prices remain well deviated above long-term trend lines.
- Long-term technical signals remain negative.
- Trade wars with both China and Mexico are weighing on consumers, exports (which make up 40-50% of corporate profits,) and economic growth.
- Rising loan delinquency rates.
- Auto sales are signaling economic stress.
- Housing continues to weaken despite low interest rates.
- The yield curve is sending a clear message that something is wrong with the economy.
- Clear stress on the consumption side of the equation from a sharp slow down in retail sales and personal consumption.
I could go on, but you get the idea.
“So what, the market is still trading near it’s highs, so apparently the market doesn’t care?”
It may certainly seem that way currently, however, as my friend and colleague Doug Kass wrote previously:
“Tops are a process and bottoms are an event, at least most of the time in the stock market. If you looked at an ice cream cone’s profile, the top is generally rounded and the bottom V-shaped. That is how tops and bottoms often look in the stock market, and I believe that the market is forming such a top now.”
He is correct.
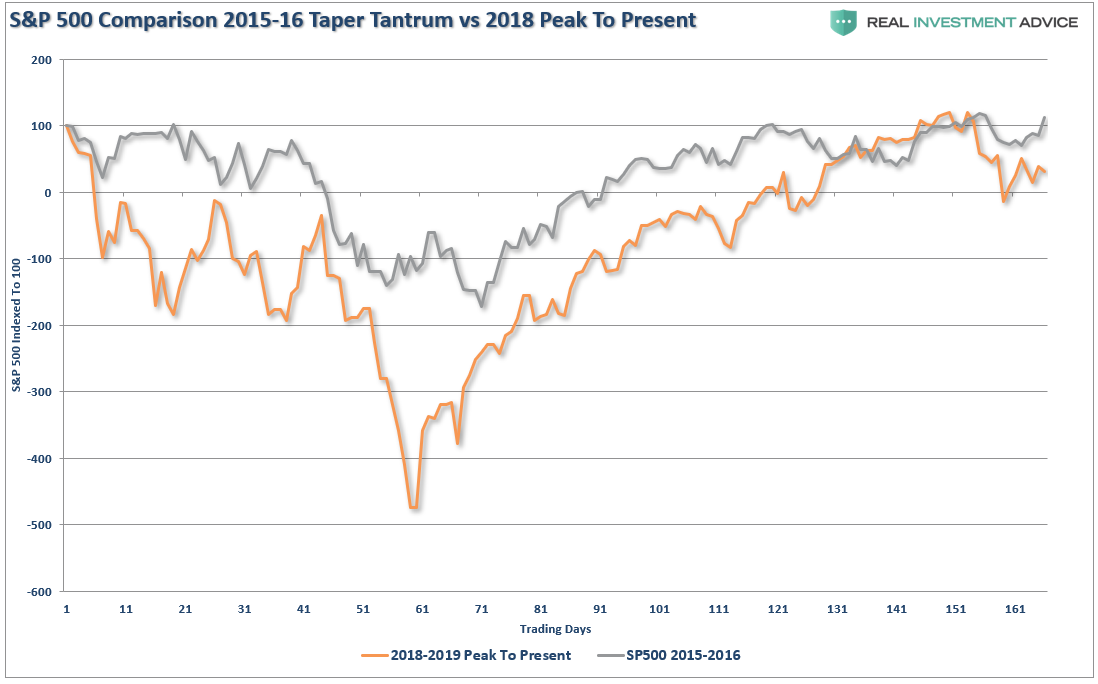
Let’s look at the current market for a moment so we have some context.
After a record breaking number of positive months in 2017 with extremely low volatility; 2018, and halfway into 2019. volatility has returned as prices have consolidated in a very broad range. After a brief correction in 2018, prices are once again well deviated above their long-term mean.
“So…is the bear market over OR is it just starting?”
The honest answer is “I don’t know.”
But, anything is certainly possible.
However, a look back through history at previous “bear market beginnings” can certainly give us some things to consider.
1974
After two previous bear market declines, as I discussed with respect to “Secular Bear Markets,” the S&P 500 broke out to all-time highs convincing the “bulls” the worse was over.
It wasn’t.
Over the next several months the markets continued in volatile trade, retesting support several times before ultimately breaking down.
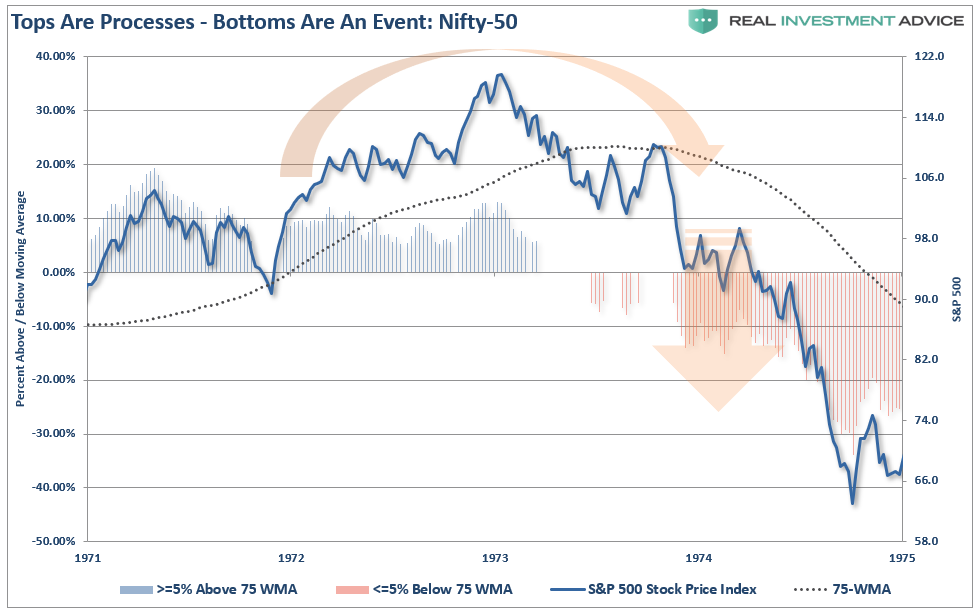
But, at this point, it was still believed just to be a correction.
The change occurred when the market rallied, and failed, at the previously broken support line at the 75-week moving average. (Which the market is currently testing once again in the chart above.)
That “failure point” marked the beginning of the “1974 Bear Market.”
1999
After the “Long-Term Capital Management” and the “Asian Contagion,” the market regained its footing and began a rampant run to all-time highs in 1999. The bulls were clearly in charge, and despite concerns of “Y2K,” stocks continued to press new highs.
While the media clamored there was no limit for stocks because of the internet and technology, the market had already began struggling to make new highs as volatility rose.
The early decline from “all-time highs” was only considered a correction as the demand by the bulls to “buy the dip” rang out loudly.
“I think you’ll see healthier and broader advances in the market. Now is the time for optimism,” said Bill Meehan, chief market analyst with Cantor Fitzgerald (4/14/2000)
It wasn’t.
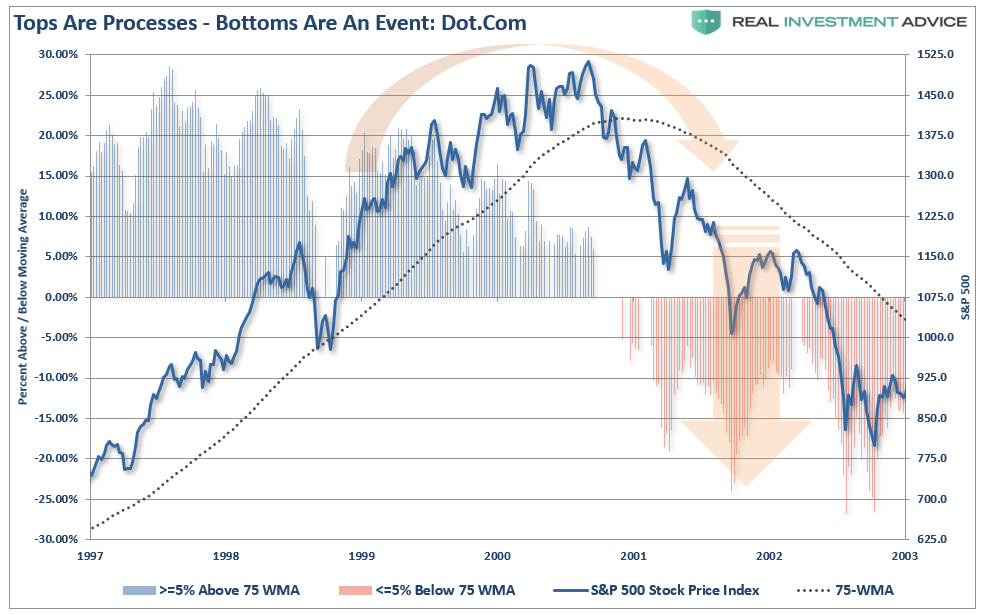
In early 2001, the market broke the long-term support line (75-week moving average) which had contained the market over the last 24-months.
Not to worry, it was simply just part of the “correction process” and many commentators on CNBC at the time were suggesting it was a “buying opportunity.”
It wasn’t.
The market rallied back, and failed, at that previously broken support line.
That point marked the end of the topping process and the beginning of the “Dot.com Crash.”
2007
In 2006, the market was rallying as real estate was going wild across the country. Firms were hocking every type of exotic mortgage derivative they could find, leverage being laid on without concern, and pension funds were being pitched “high yield” opportunities.
As the market broke out to new highs, there was little concern as there was “no recession in sight and subprime mortgages were contained,” and it was a “Goldilocks economy.”
Over the next year the market repeatedly hit new highs. Each new high was followed by a decline which tested broadening support giving the bulls repeated opportunities to call for “dip buying.”
It was believed the year-long consolidation process was simply the “set up” for the continuation of the bull market.
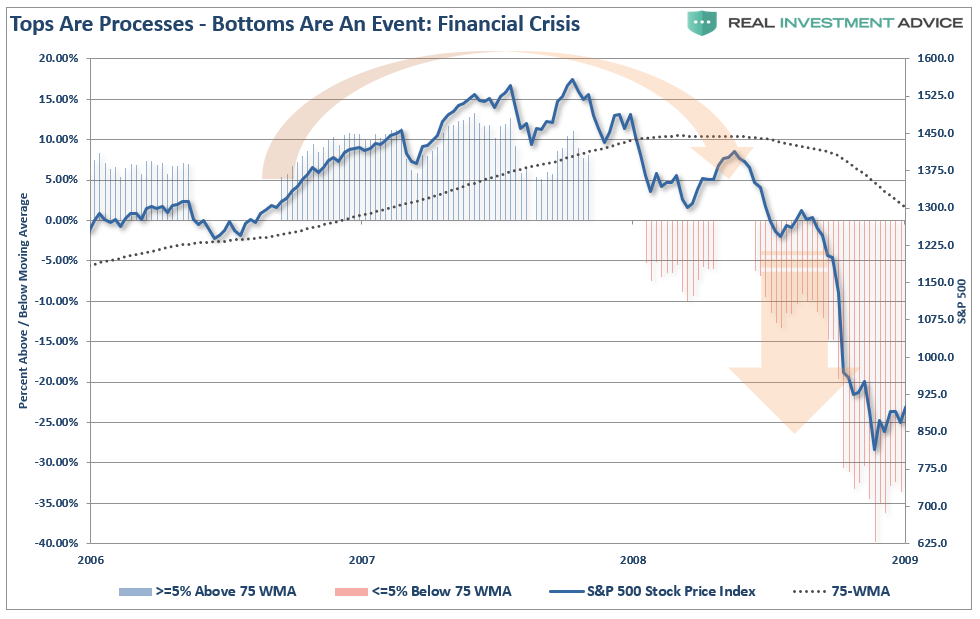
In early 2008, the running support line was broken as “Bear Stearns” failed sending off alarm bells to which few listened. The market rallied backed, and failed, at the previously broken support line.
That point marked the end of the topping process and the real beginning of the “Financial Crisis.”
By now, you should realize the similarities between all of these previous market tops and what is happening currently. However, it wasn’t just price movements that each of these previous bear markets had in common with the market today.
Fundamental similarities also existed:
- Valuations were high
- Dividend yields were low
- Federal Reserve was hiking interest rates
- Economy was believed to be strong
- Earnings were expected to continue to grow
- Corporate balance sheets were believed to be strong
- Yield curve was flattening
- “There was no recession in sight.”
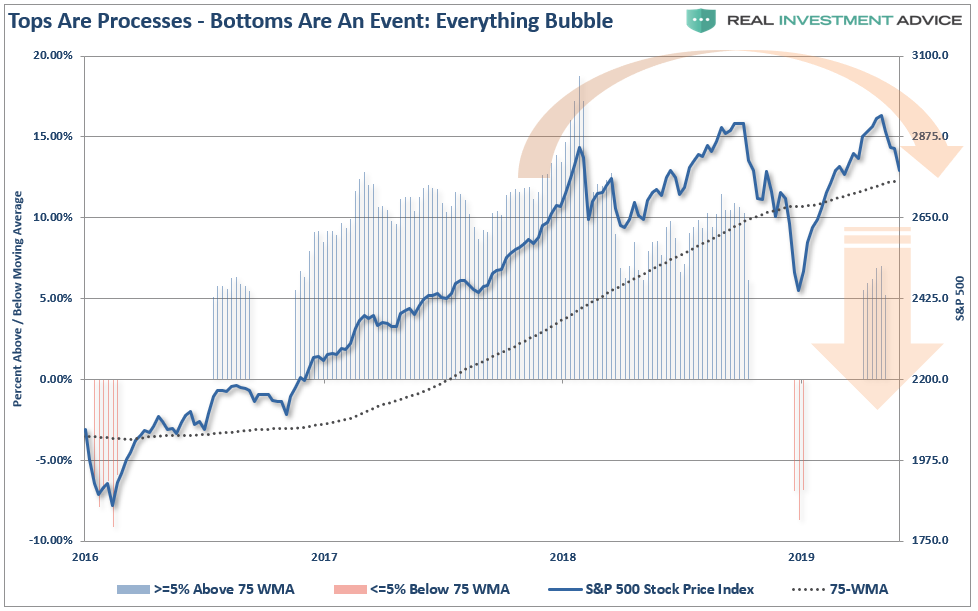
The Big Test
The market is once again testing the all-import running support line.
With the market NOT oversold (top panel) and on a sell signal (lower panel) a weekly close below the 75-week moving average will suggest a retest of the 2600 level.
If the market fails to hold that support, there is nothing stopping the markets from retesting the December 24th lows.
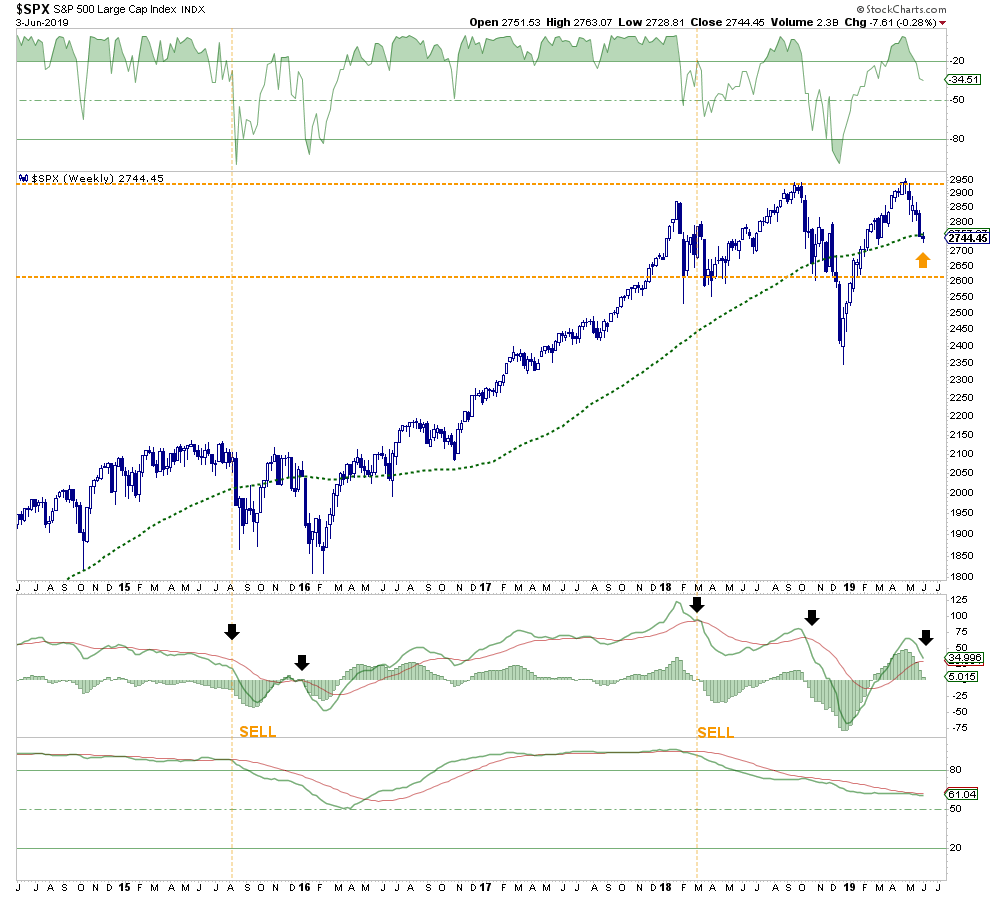
Given the market has fully reversed the December oversold condition, is approaching a sell signal (black arrow), and with multiple moving averages just overhead, the market has its work cut out for it. It won’t take much to derail stocks at this point and there are plenty of issues to choose from as outlined above.
Sure, the bulls can certainly turn it around, but that is only one possibility out of many others which pose a far greater risk to capital. With the economic data slowing, and earnings likely to be weaker than expected, and the Fed still holding tighter monetary conditions, and yields collapsing across the curve, the current sell-off may be different than what we have seen in the past.
As we have continuously repeated, if you didn’t like the November-December decline, it is simply a function that you have built up more uncontrolled risk in your portfolio than you previously realized.
In this past weekend’s missive, we laid out the potential for a counter-trend short-term rally. We suggest you use any rally to rebalance risk, sell losers and laggards, and add to fixed income and cash.
Conclusion
“Confronted with a challenge to distill the secret of sound investment into three words, we venture the motto, Margin of Safety.” –Benjamin Graham
The search for value and comparing it to risk taken is, at its core, the marriage of a contrarian streak and a calculator.
While it is important to gauge the possibility that the market may be making an important top, it is even more important to distill, based on reasonable fundamental input, what the market’s reward vs. risk is.
As Doug noted:
“This calculus trumps everything else that I do in determining market value. On that front, I continue to believe that downside risk dwarfs upside reward. Moreover, there is a growing fundamental and technical list of signposts that may suggest that the market is starting to look likeit is in the process of making a possible (and important) top.”
As always, long-term portfolio management is about “tweaking” things over time.
1) Trim Winning Positions back to their original portfolio weightings. (ie. Take profits)
2) Sell Those Positions That Aren’t Working. If they don’t rally with the market during a bounce, they are going to decline more when the market sells off again.
3) Move Trailing Stop Losses Up to new levels.
4) Review Your Portfolio Allocation Relative To Your Risk Tolerance. If you are aggressively weighted in equities at this point of the market cycle, you may want to try and recall how you felt during 2008. Raise cash levels and increase fixed income accordingly to reduce relative market exposure.
Could I be wrong? Absolutely.
But this is why small moves are important.
What’s worse:
- Missing out temporarily on the initial stages of a longer-term advance, or;
- Spending time getting back to even, which is not the same as making money.
For the majority of investors, the recent rally has simply been a recovery of what was lost last year. In other words, while investors have made no return over the last 18 months, they have lost 18 months of their retirement saving time horizon.
The decline was small last time.
But what about next time?
The true power of compounding is not found in “the winning,” but in the “not losing.”
As noted in our article on trading rules:
“Opportunities are made up far easier than lost capital.” – Todd Harrison


