
Technical Stock Chart Analysis: Alphabet (GOOGL)
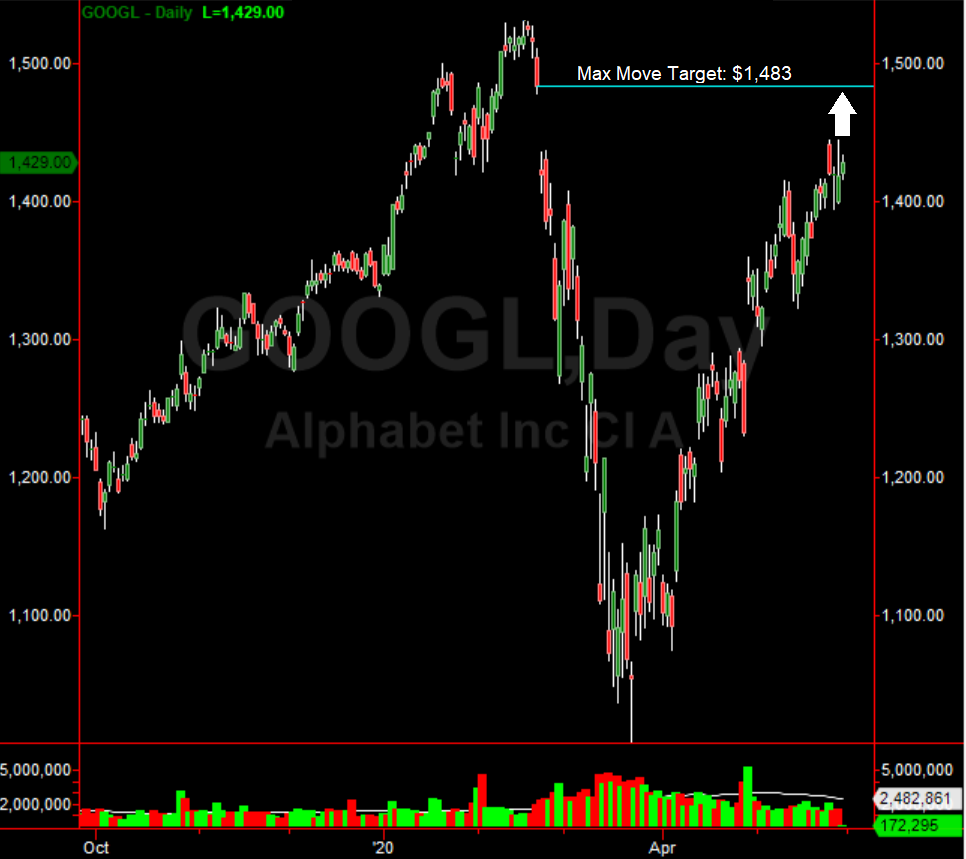
Shares of Alphabet Inc (GOOGL) continue to grind higher, having rallied from near $1,000 in late March 2020, to the current $1,429.00. Investors and swing traders are wondering where the technical stock chart analysis will take the stock before it becomes a sell or short. The answer to that is $1,483.00. There is a significant gap fill at this level, representing major resistance. In addition, the RSI (relative strength index) is nearing the overbought level of 70 but not quite there. This continues to signal a little more upside on Alphabet before it tops out.
The swing trade is simple here. Technical stock chart analysis says short Alphabet Inc at $1,483. A corrective move (drop) of more than 10% is expected based on the almost 500 rally in Alphabet. In other intriguing news, it was announced today that Alphabet Inc is rescinding offers for part-time contractors they were set to hire. This tells the smart investors and swing traders that Alphabet is seeing a major slowing in demand for their advertising services as well as other products. This will likely be part of the sell off factor once the upside target is tagged.
(Click on image to enlarge)
Disclosure: None.


