
Technical Market Report For Saturday, May 22

The good news is the number of new lows continues to decline.
The Negatives
New highs are an indication of the breadth of a move and new highs have continued to deteriorate.
The first chart covers the past 6 months showing the NASDAQ composite (OTC) in blue and a 10% trend (19 day EMA) of NASDAQ new highs (OTC NH) in green. Dashed vertical lines have been drawn on the first trading day of each month.
OTC NH continued to deteriorate in spite of rising prices.

The next chart is similar to the first one except it shows the SPX in red and NY NH, in green, has been calculated with NYSE data.
The continuing deterioration of new highs in spite of firming prices is not a good sign.

The Positives
New lows declined to comfortable levels last week.
The next chart covers the past 6 months showing the OTC in blue and a 10% trend (19 day EMA) of NASDAQ new lows (OTC NL) in brown. OTC NL has been plotted on an inverted Y axis so decreasing numbers of new lows move the indicator upward (up is good).
OTC NL is recovering, but remains uncomfortably high.

The next chart is similar to the previous one except it shows the SPX in red and NY NL, in blue, has been calculated with NYSE data.
NY NL is recovering sluggishly, but recovering. The level of the indicator is not threatening.

The next chart covers the past 6 months showing the OTC in blue and a 40% trend (4 day EMA) of NASDAQ new highs divided by new highs + new lows (OTC HL Ratio), in red. Dashed horizontal lines have been drawn at 10% levels for the indicator; the line is solid at the 50%, neutral level.
OTC HL Ratio recovered to a modestly positive 67% last week.

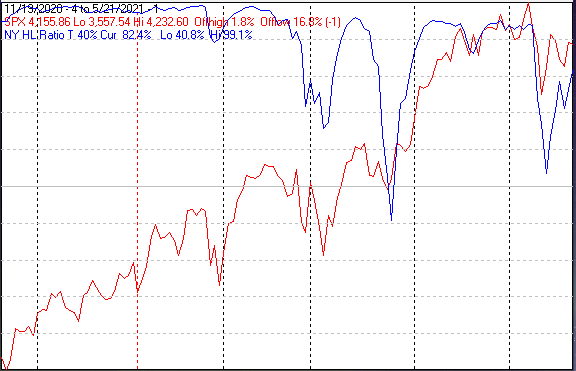
The next chart is similar to the one above except it shows the SPX in red and NY HL ratio, in blue has been calculated with NYSE data.
NY HL Ratio rose to a comfortable 82%.
Seasonality
Next week includes the last 5 trading days of May during the first year of the Presidential Cycle. The tables below show the daily change, on a percentage basis, for that period.
OTC data covers the period from 1963 to 2020 while SPX data runs from 1928 to 2020. There are summaries for both the first year of the Presidential Cycle and all years combined.
Average returns for the coming week have been positive by all measures.
Report for the last 5 days of May
The number following the year represents its position in the Presidential Cycle.
The number following the daily return represents the day of the week;
1 = Monday, 2 = Tuesday etc.
OTC Presidential Year 1 (PY1)
Day5 Day4 Day3 Day2 Day1 Totals
1965-1 -0.33% 1 -0.73% 2 0.60% 3 -0.83% 4 -0.36% 5 -1.65%
1969-1 0.54% 5 -0.13% 1 -0.09% 2 -0.75% 3 -0.27% 4 -0.70%
1973-1 2.14% 4 0.86% 5 -0.30% 2 -1.58% 3 -0.53% 4 0.58%
1977-1 -0.50% 2 -0.50% 3 -0.01% 4 -0.28% 5 -0.32% 2 -1.62%
1981-1 0.40% 5 0.46% 2 0.88% 3 0.51% 4 0.07% 5 2.32%
1985-1 0.00% 5 -0.43% 2 -0.08% 3 -0.24% 4 0.30% 5 -0.46%
1989-1 0.30% 3 0.32% 4 0.52% 5 -0.22% 2 0.44% 3 1.36%
1993-1 0.06% 1 0.05% 2 1.30% 3 0.07% 4 -0.58% 5 0.90%
1997-1 1.25% 5 1.40% 2 0.07% 3 -0.51% 4 -0.19% 5 2.02%
Avg 0.40% 0.36% 0.54% -0.08% 0.01% 1.23%
2001-1 1.72% 4 -1.36% 5 -3.35% 2 -4.18% 3 1.25% 4 -5.93%
2005-1 0.24% 2 -0.56% 3 1.03% 4 0.22% 5 -0.36% 2 0.57%
2009-1 -0.19% 5 3.45% 2 -1.11% 3 1.20% 4 1.29% 5 4.64%
2013-1 -0.01% 5 0.86% 2 -0.61% 3 0.69% 4 -1.01% 5 -0.09%
2017-1 0.40% 3 0.69% 4 0.08% 5 -0.11% 2 -0.08% 3 0.97%
Avg 0.43% 0.62% -0.79% -0.44% 0.22% 0.03%
OTC summary for PY1 1965 - 2017
Averages 0.43% 0.31% -0.08% -0.43% -0.03% 0.21%
% Winners 64% 57% 50% 36% 36% 57%
MDD 5/30/2001 8.65% -- 5/31/1973 2.41% -- 5/28/1965 1.65%
OTC summary for all years 1963 - 2020
Averages 0.12% 0.10% 0.05% 0.25% 0.20% 0.72%
% Winners 54% 55% 60% 59% 64% 60%
MDD 5/30/2001 8.65% -- 5/25/1999 5.52% -- 5/31/2002 4.82%
SPX PY1
Day5 Day4 Day3 Day2 Day1 Totals
1929-1 -0.36% 6 -3.32% 1 1.61% 2 0.12% 3 0.85% 5 -1.09%
1933-1 -0.77% 4 2.86% 5 3.21% 6 1.45% 1 -1.43% 3 5.33%
1937-1 -0.18% 1 -1.28% 2 -0.12% 3 0.18% 4 0.00% 5 -1.40%
1941-1 -1.27% 1 0.64% 2 0.00% 3 -0.11% 4 -0.32% 6 -1.05%
1945-1 0.61% 5 0.54% 6 1.08% 1 0.53% 2 -0.66% 4 2.10%
1949-1 -0.55% 2 0.48% 3 -0.07% 4 -0.34% 5 -2.21% 2 -2.68%
1953-1 -0.16% 1 -0.48% 2 -0.92% 3 -0.73% 4 0.33% 5 -1.97%
1957-1 0.13% 5 -0.91% 1 -0.19% 2 0.90% 3 0.68% 5 0.60%
Avg -0.25% 0.06% -0.02% 0.05% -0.44% -0.60%
1961-1 -0.25% 2 -0.63% 3 -0.38% 4 0.64% 5 0.20% 3 -0.43%
1965-1 -0.74% 1 0.58% 2 -0.34% 3 -0.52% 4 0.66% 5 -0.36%
1969-1 -0.01% 5 -0.22% 1 -0.76% 2 -0.30% 3 0.19% 4 -1.09%
1973-1 2.95% 4 0.75% 5 -0.40% 2 -1.49% 3 -0.91% 4 0.90%
1977-1 -0.49% 2 -0.92% 3 0.25% 4 -0.76% 5 -0.16% 2 -2.08%
Avg 0.29% -0.09% -0.32% -0.49% 0.00% -0.61%
1981-1 -0.32% 5 1.10% 2 0.75% 3 -0.24% 4 -0.64% 5 0.65%
1985-1 0.37% 5 -0.23% 2 -0.10% 3 0.04% 4 0.96% 5 1.04%
1989-1 0.26% 3 0.01% 4 0.76% 5 -0.79% 2 0.46% 3 0.70%
1993-1 0.48% 1 0.19% 2 1.02% 3 -0.23% 4 -0.49% 5 0.98%
1997-1 1.36% 5 0.32% 2 -0.29% 3 -0.37% 4 0.50% 5 1.51%
Avg 0.43% 0.28% 0.43% -0.32% 0.16% 0.98%
2001-1 0.32% 4 -1.18% 5 -0.78% 2 -1.57% 3 0.62% 4 -2.59%
2005-1 0.02% 2 -0.34% 3 0.64% 4 0.10% 5 -0.61% 2 -0.19%
2009-1 -0.15% 5 2.63% 2 -1.90% 3 1.54% 4 1.36% 5 3.48%
2013-1 -0.06% 5 0.63% 2 -0.70% 3 0.37% 4 -1.43% 5 -1.19%
2017-1 0.25% 3 0.44% 4 0.03% 5 -0.12% 2 -0.05% 3 0.56%
Avg 0.08% 0.44% -0.54% 0.06% -0.02% 0.01%
SPX summary for PY1 1929 - 2017
Averages 0.06% 0.07% 0.10% -0.07% -0.09% 0.08%
% Winners 43% 57% 39% 43% 48% 48%
MDD 5/27/1929 3.66% -- 5/30/2001 3.49% -- 5/31/1973 2.77%
SPX summary for all years 1928 - 2020
Averages -0.08% 0.09% -0.04% 0.23% 0.01% 0.21%
% Winners 52% 57% 48% 61% 55% 60%
MDD 5/31/1932 14.20% -- 5/28/1962 9.18% -- 5/29/1931 5.92%
Conclusion
Price wise, last week was pretty dull. Fortunately new lows declined suggesting positive price behavior ahead.
The strongest sectors last week were Banks and Precious Metals while the weakest were Basic Material and Retail.
I expect the major averages to be higher on Friday, May 28, than they were on Friday, May 21.
Last week the OTC was up a little while the other indices were down a little so, I am calling last week;s positive forecast a tie.


