
Technical Market Report For Saturday, Jan. 22

Image source: Pixabay
The good news is:
- We are experiencing seasonal weakness that should end in the next 2 weeks.
The Negatives
There were 525 new lows on the NYSE Friday and 1315 on the Nasdaq; these are crash numbers. So far there has been no sigh of a bottom.
The first chart covers the past 6 months showing the Nasdaq composite (OTC) in blue and a 40% trend (4 day EMA) of Nasdaq new highs divided by new highs + new lows (OTC HL Ratio), in red. Dashed vertical lines have been drawn on the 1st trading day of each month and dashed horizontal lines have been drawn at 10% levels for the indicator; the line is solid at the 50%, neutral level.
OTC HL Ratio at 5.5% cannot go much lower.

The next chart is similar to the first one except it shows the S&P 500 (SPX) in red and NY HL ratio, in blue, has been calculated with NYSE data.
NY HL Ratio is near its low of early December; show no sigh of strength.

The next chart covers the past 6 months showing the SPX in red and a 10% trend (19 day EMA) of NYSE new highs (NY NH) in green.
You could call this a non confirmation of the early December low, unfortunately that interpretation it is not relevant.

The next chart is similar to the one above except it shows the OTC in blue and OTC NH, in green, has been calculated with Nasdaq data.
Ditto.

The next chart covers the past 6 months showing the OTC in blue and a 10% trend (19 day EMA) of Nasdaq new lows (OTC NL), in brown. OTC NL has been plotted on an inverted Y axis so decreasing numbers of new lows move the indicator upward (up is good).
This chart and the next one are the charts that matter and there is no sign of a non confirmation.

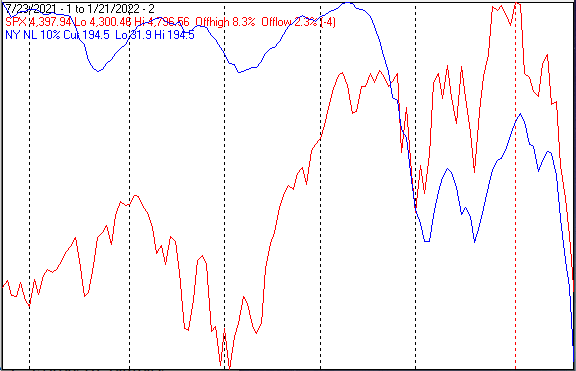
The next chart is similar to the one above except it shows the SPX in red and NY NL has been calculated with NYSE data.
Ditto.
The Positives
This decline is following the seasonal pattern for the 2nd year of the Presidential Cycle. If it continues to follow that pattern this cycle bottom should occur in the next 2 weeks followed by a nice rally into mid April.
Seasonality
Next week includes the 5 trading days prior to the 4th Friday of January during the 2nd year of the Presidential Cycle. The tables below show the daily change, on a percentage basis, for that period.
OTC data covers the period from 1963 to 2020 while SPX data runs from 1953 to 2020. There are summaries for both the 2nd year of the Presidential Cycle and all years combined. Prior to 1953 the market traded 6 days a week so that data has been ignored.
Average returns for the coming week have been mixed and weaker during the 2nd year of the Presidential Cycle than other years,
Report for the week before the 4th Friday of January.

The number following the year is the position in the Presidential Cycle.

Daily returns from Monday through the 4th Friday.


OTC Presidential Year 2 (PY2)

 Year       Mon     Tue     Wed    Thur    Fri    Totals

 1966-2   0.12%  -0.07%   0.27%  -0.08%   0.02%   0.25%

 1970-2  -0.93%  -0.91%   0.00%   0.31%   0.18%  -1.36%

 1974-2  -0.88%   0.86%   0.49%  -0.16%  -0.22%   0.09%

 1978-2  -0.29%   0.20%   0.33%  -0.34%   0.09%  -0.01%


 1982-2  -1.24%  -0.06%   0.09%   1.44%   1.17%   1.39%

 1986-2  -0.37%  -0.30%  -0.54%  -0.02%   0.66%  -0.56%

 1990-2  -2.03%  -0.38%  -1.08%  -0.10%  -0.92%  -4.50%

 1994-2  -0.46%  -0.54%   0.31%   0.52%   0.46%   0.29%

 1998-2   0.00%   1.74%  -0.14%  -0.72%  -0.04%   0.85%


 Avg     -1.02%   0.09%  -0.27%   0.22%   0.27%  -0.51%


 2002-2   0.00%  -2.48%   2.12%   1.05%  -0.25%   0.44%

 2006-2   0.03%   0.75%  -0.20%   0.99%   0.93%   2.50%

 2010-2   0.25%  -0.32%   0.80%  -1.91%  -1.45%  -2.63%

 2014-2   0.00%   0.67%   0.41%  -0.57%  -2.15%  -1.64%

 2018-2   0.97%   0.70%  -0.60%  -0.05%   1.27%   2.29%


 Avg      0.42%  -0.14%   0.50%  -0.10%  -0.33%   0.19%


OTC summary for PY2 1966 - 2018

 Avg     -0.44%  -0.01%   0.17%   0.03%  -0.02%  -0.19%

 Win%       36%     43%     62%     36%     57%     57%


OTC summary for all years 1963 - 2021

 Avg     -0.14%  -0.06%   0.18%   0.11%   0.01%   0.13%

 Win%       53%     50%     58%     49%     67%     59%


SPX PY2

 Year       Mon     Tue     Wed    Thur    Fri    Totals

 1954-2   0.31%   0.62%  -0.31%   0.04%   0.23%   0.89%

 1958-2   0.61%  -0.12%  -0.24%   0.39%   0.85%   1.48%


 1962-2   0.09%  -0.76%   0.16%  -0.07%  -0.32%  -0.90%

 1966-2   0.26%   0.15%  -0.16%  -0.03%  -0.38%  -0.17%

 1970-2  -1.40%   0.20%   0.09%   0.04%  -0.98%  -2.04%

 1974-2  -0.17%   1.21%   0.54%  -0.26%  -0.20%   1.12%

 1978-2  -0.72%   0.01%   0.16%  -0.91%   0.00%  -1.46%


 Avg     -0.39%   0.16%   0.16%  -0.24%  -0.47%  -0.69%


 1982-2   0.03%  -0.19%   0.48%   2.75%   1.24%   4.30%

 1986-2  -0.43%  -0.84%  -1.12%   0.37%   1.07%  -0.95%

 1990-2  -2.59%   0.37%  -0.41%  -1.27%  -0.09%  -3.97%

 1994-2  -0.58%  -0.22%   0.48%   0.81%   0.35%   0.84%

 1998-2   0.00%   1.78%  -0.80%  -0.80%  -0.57%  -0.38%


 Avg     -0.89%   0.18%  -0.27%   0.37%   0.40%  -0.03%


 2002-2   0.00%  -0.73%   0.79%   0.35%   0.10%   0.51%

 2006-2   0.18%   0.24%  -0.17%   0.72%   0.78%   1.75%

 2010-2   0.46%  -0.42%   0.49%  -1.18%  -0.98%  -1.64%

 2014-2   0.00%   0.28%   0.06%  -0.89%  -2.09%  -2.64%

 2018-2   0.81%   0.22%  -0.06%   0.06%   1.18%   2.21%


 Avg      0.48%  -0.08%   0.22%  -0.19%  -0.20%   0.04%


SPX summary for PY2 1954 - 2018

 Avg     -0.22%   0.11%   0.00%   0.01%   0.01%  -0.06%

 Win%       57%     59%     53%     53%     50%     47%


SPX summary for all years 1953 - 2021

 Avg     -0.11%   0.02%   0.16%   0.14%  -0.01%   0.22%

 Win%       52%     59%     58%     60%     53%     64%
Conclusion
Seasonality indicates this decline has another week or two to go followed by a nice rally into mid April.
The strongest sectors last week were Precious Metals and Energy while the weakest were Electronics and Retail.
I expect the major averages to be lower on Friday, January 28 than they were on Friday, January 21.


