
Technical Chart Analysis On Boeing: Alert
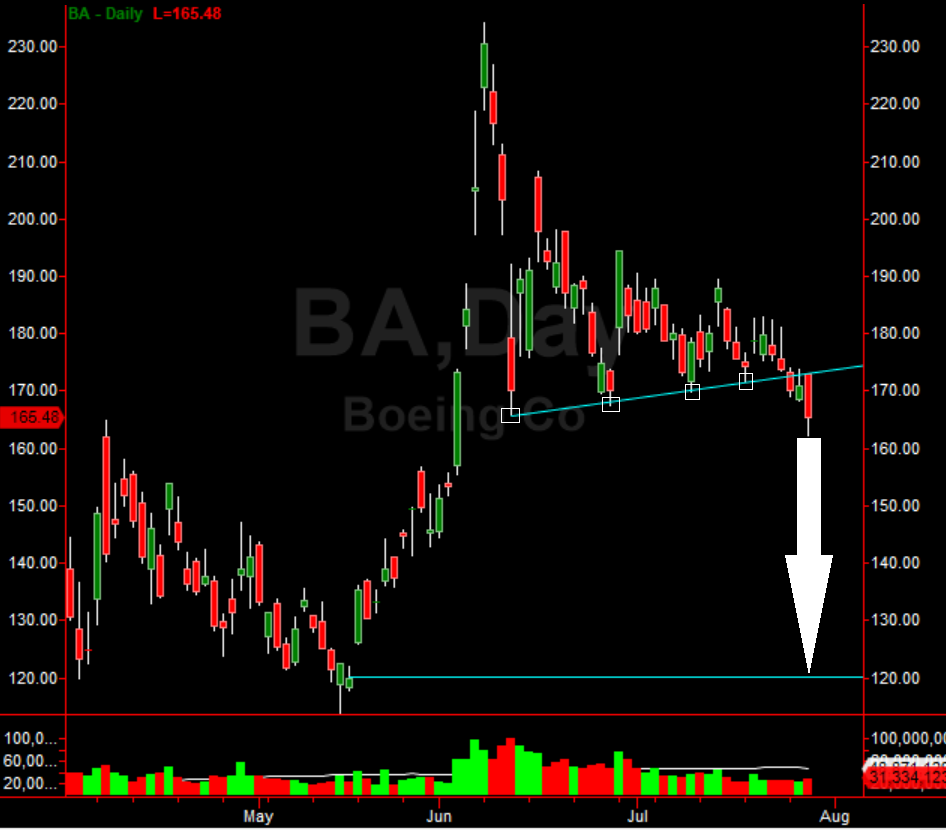
Shares of Boeing Co (BA) reported earnings that had the stock slightly higher in pre-market trading. However, the sellers came out strong at the open and the stock is sharply lower. Chart analysis on Boeing paints a nasty picture of a major technical breakdown. The downside is likely to the $120.00 level in the coming weeks. A simple task of connecting the recent lows of June 11th, June 26th, July 10th, and July 20th reveals a major trend line of support. Per two days ago, the stock dropped below that trend line (seen in the chart below). Chart analysis on Boeing shows the likely confirmation of that break today. This means the stock is in collapse mode until major support at $120.00.
(Click on image to enlarge)
Disclosure: None.
How did you like this article? Let us know so we can better customize your reading experience.

Comments
Leave a comment to automatically be entered into
our contest to win a free Echo Show.

