Looking at the AYI’s chart, we can see that it was lastly traded at around $183. Today it is announcing its quarterly earnings and it seems that the market’s anticipation is positive.
Today’s instrument is Acuity Brands Inc., an industrial technology company, whose stock is traded on the NYSE exchange under the ticker AYI.
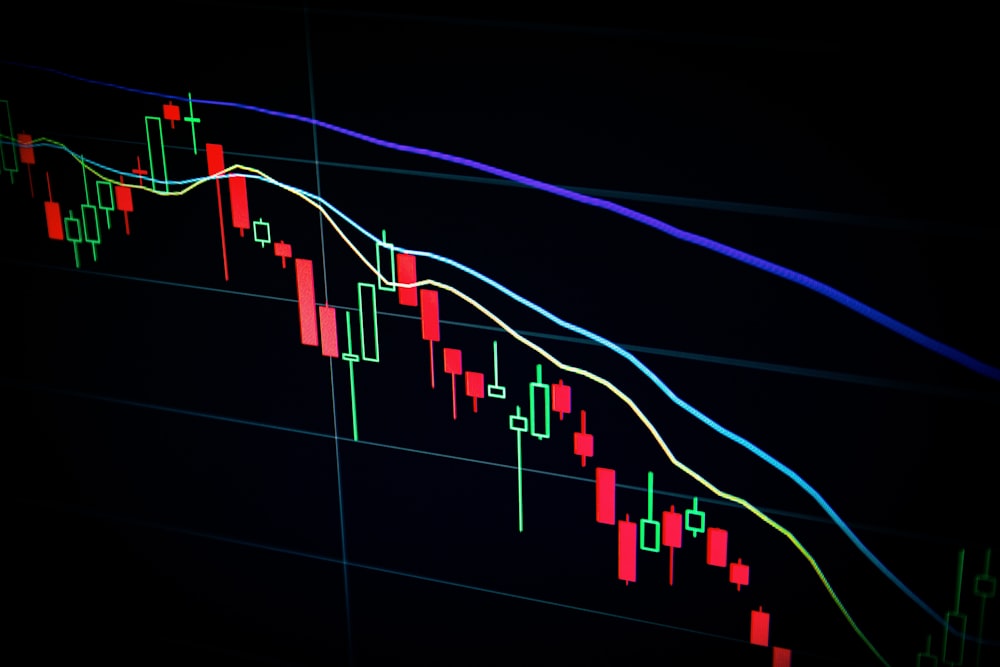
Looking at the AYI’s chart, we can see that it was lastly traded at around $183.
Today it is announcing its quarterly earnings and it seems that the market’s anticipation is positive as it has been in an uptrend in the past couple of days. Therefore, today it could continue the upward direction towards its resistance level which is located at around $94.80-$95.
Trading is risky. Information presented herein, is not to be constructed as a solicitation or an offer to buy or sell any Financial Instrument or to participate in any particular trading strategy. Acuity Brands’ Inc. logo and any associated brand names are Acuity Brands’ Inc. trademarks. All other trademarks are property of their respective owners.
Foreign exchange (Forex) trading carries a high level of risk and may not be suitable for all investors. The risk grows as the leverage is higher. Investment objectives, risk appetite and the trader’s level of experience should be carefully weighed before entering the Forex market. There is always a possibility of losing some or all of your initial investment / deposit, so you should not invest money which you cannot afford to lose. The high risk that is involved with currency trading must be known to you. Please ask for advice from an independent financial advisor before entering this market. Any comments made on Forex Crunch or on other sites that have received permission to republish the content originating on Forex Crunch reflect the opinions of the individual authors and do not necessarily represent the opinions of any of Forex Crunch’s authorized authors. Forex Crunch has not verified the accuracy or basis-in-fact of any claim or statement made by any independent author: Omissions and errors may occur. Any news, analysis, opinion, price quote or any other information contained on Forex Crunch and permitted re-published content should be taken as general market commentary. This is by no means investment advice. Forex Crunch will not accept liability for any damage, loss, including without limitation to, any profit or loss, which may either arise directly or indirectly from use of such information.


Comments
Log in or sign up to join the conversation.