
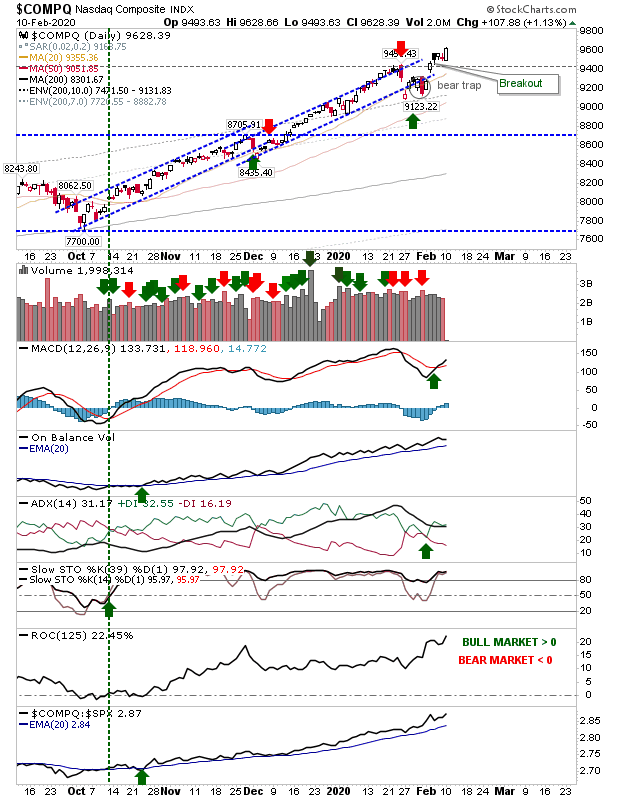
Tech Indices Follow Through Gains
It was a good day for all markets, but as the Nasdaq was leading other indices with its breakout it was important for this move to hold. It did so with little concern, helping to boost an already strong technical picture. The 90% threshold of historic overbought action won't be reached until the index tags 9,706. However, the Nasdaq has made it to the 85% marker - a point where profit-taking and/or selling covered calls should be considered; the last time this occurred was in January 2018.
(Click on image to enlarge)
The S&P edged a breakout and in the process also crossed the 85% of historic extreme price action (dating back to 1950). The MACD returned to a 'buy' trigger above the bullish zero line with other technicals in good shape.
(Click on image to enlarge)

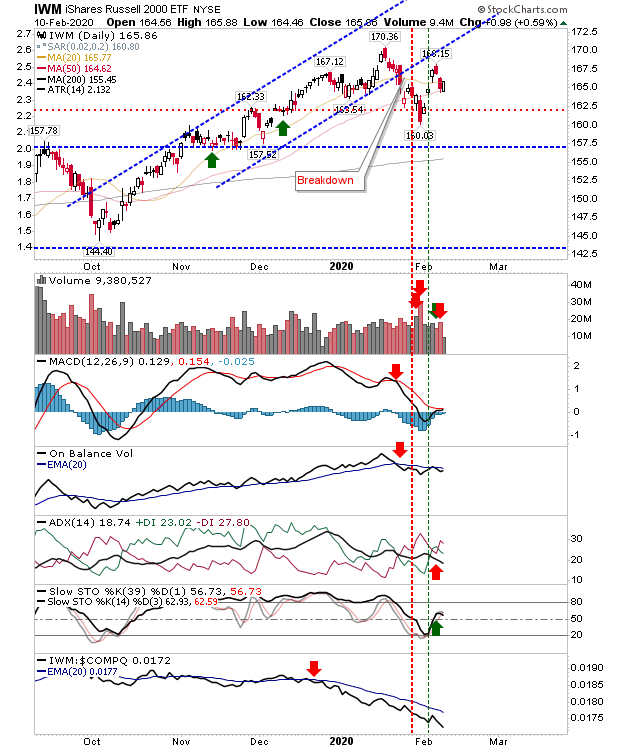
Small Caps are caught in the middle, although today did deliver a successful defense of the 50-day MA. Technicals are mostly bearish with the exception of Stochastics. For now, traders are best to focus on the Nasdaq and S&P as they drive to new all-time highs; Small Caps will have their day, but it's not the time for them yet.
(Click on image to enlarge)
We are now looking at a picture where indices are reaching historic extremes. This can last a number of months, but historically, this has been followed by either a sideways pattern (as happened in 2018) or a direct correction (pick any market crash), but we are close to a peak high - probably for the year.


