
Study The Performance Of Global Size Benchmarks
The S&P Global BMI serves as a benchmark that measures global stock market performance. The index consists of three mutually exclusive and exhaustive size benchmarks: The S&P Global LargeCap, the S&P Global MidCap, and the S&P Global SmallCap. These indices are float market capitalization-weighted and reconstituted annually in September, following the same weighting scheme and rebalancing schedule as their benchmark index.
We compared risk/return profiles for the three size benchmarks, using monthly data from Dec. 30, 1994, to March 31, 2021. The S&P Global SmallCap and S&P Global MidCap outperformed the S&P Global LargeCap more than half of the time, with the S&P Global SmallCap defeating the S&P Global LargeCap 166 out of 315 months (a 52.7% outperformance hit rate) and the S&P Global MidCap beating the S&P Global LargeCap 162 out of 315 months (a 51.6% outperformance hit rate).
Exhibit 1 shows that over the long term, especially in periods longer than 15 years, the S&P Global SmallCap and S&P Global MidCap delivered higher returns than the S&P Global LargeCap. After showing underperformance for the 5- and 10-year periods, both smaller-cap indices carried on strongly during the volatile markets triggered by the COVID-19 pandemic. The S&P Global SmallCap consistently showed the highest rate of volatility, while the S&P Global LargeCap displayed the lowest volatility across the same periods.

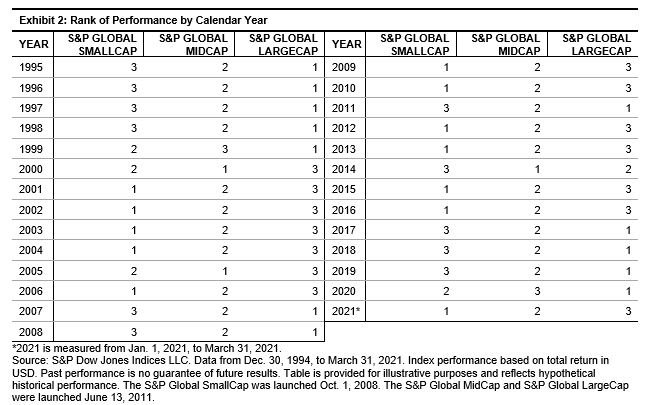
Exhibit 2 shows the rank of performance by calendar year with 1 indicating the best performer and 3 representing the worst performer. Over the past 27 years, the S&P Global SmallCap and the S&P Global LargeCap took turns in the winning position, each taking the lead for 12 years, while the MidCap was positioned as second place for 22 years.
The historical average sector weights shown in Exhibit 3 indicate that there has been no significant difference in sector allocation among the three size indices overall. However, the S&P Global SmallCap and S&P Global MidCap have been overweighted in the Utilities and Communication Services sectors, while the S&P Global LargeCap has been overweighted in the Industrials, Information Technology, and Health Care sectors. The Financials sector has had the highest weight in all three size indices throughout the history, with an average weight of more than 20%. The Communication Services sector (reclassified from Telecommunication Services in 2018) shows the lowest weight in all three indices.

While the S&P Global LargeCap led the markets over the 5- and 10-year periods, the S&P Global SmallCap had the best performance over the longer term, since the end of 1994. The S&P Global LargeCap displayed consistently lower volatility compared with the other two size indices across various time periods. On the other hand, the S&P Global SmallCap demonstrated relatively higher volatility but kept a winning momentum over the past year.
The S&P Global LargeCap, MidCap, and SmallCap indices performed differently over different time horizons. Because of their return/risk patterns over these different time horizons, an investment in a particular size category that had higher returns during one period could potentially help to offset losses in another. Understanding the risk/return patterns of the size indices can potentially help achieve return/risk targets for certain investment portfolios.
Disclaimer: Copyright © 2021 S&P Dow Jones Indices LLC, a division of S&P Global. All rights reserved. This material is reproduced with the prior written consent of S&P DJI. Please ...
more

